Data Cleaning and Handling Missing Data in Machine Learning
In the realm of machine learning, data is at the heart of every model's success. However, raw data, in its natural form, is often messy, incomplete, and riddled with inconsistencies. One of the most challenging aspects of preparing data for machine learning is handling missing data. Missing values can stem from various factors such as data collection errors, human oversight, or technical issues, and they can drastically affect the performance and accuracy of machine learning models.
In this blog, we will dive deep into data cleaning, focusing specifically on handling missing data. We’ll cover the types of missing data, why it matters, and the different strategies and techniques to manage it, ensuring that the dataset is ready for optimal model performance.
1. What is Missing Data?
In data science and machine learning, missing data refers to the absence of a value or observation in one or more features (or attributes) within a dataset. In simpler terms, it happens when a specific data point or variable is unavailable or has not been recorded during data collection, and this can significantly impact the analysis and the performance of machine learning models.
Missing data is a common challenge faced by data scientists, as it often leads to biases, inaccuracies, and loss of information. If not handled properly, missing data can distort statistical analyses and machine learning models, leading to poor predictions or insights. Therefore, understanding the causes of missing data and how to handle it effectively is crucial for data preprocessing.
Causes of Missing Data
Missing data can occur due to a variety of reasons. The underlying cause often provides insights into how the missing values can be handled. Below are some common causes:
A. Data Entry Errors
Mistakes or errors made during data entry or data collection are one of the most common causes of missing data. These errors may arise due to human oversight or technical issues, such as incorrect formatting, typos, or misinterpretation of the data.
For example, if a dataset is being manually inputted by multiple users, a certain field might be overlooked or left blank, leading to missing values.
B. Non-Availability of Data
There are instances when certain data points may not apply to some entries in a dataset. This occurs when the value for a particular feature is not relevant or available for certain records.
For example:
- In a survey about health habits, some individuals may not have a middle name, and thus, the "middle name" field would be left empty for them.
- In a dataset of car attributes, the "sunroof" feature may be missing for cars that don't have one.
This type of missing data is often intentional and does not imply an error, but rather a lack of relevance or applicability for certain instances.
C. Data Corruption
Another reason for missing data is data corruption. This typically happens due to technical issues like hardware failures, network interruptions, or software glitches during the data collection or transmission process.
For example, if data is being transferred from a sensor to a database, a sudden interruption may result in missing data or incomplete records. Similarly, data corruption can also occur if files become corrupted, leading to the loss of certain values.
D. Privacy Concerns
In certain situations, privacy concerns or legal regulations may dictate that certain data points be intentionally omitted. This is particularly common in sensitive areas such as healthcare, finance, and customer data.
For example, when collecting demographic information, some individuals may choose not to provide personal details like income or ethnicity due to privacy concerns. In such cases, these data points may be missing or intentionally left blank.
Classification of Missing Data
Understanding the nature of missing data is critical for choosing the most appropriate method to handle it. Missing data can be classified into three main categories based on the relationship between the missing data and the other variables in the dataset:
A. Missing Completely at Random (MCAR)
When data is Missing Completely at Random (MCAR), the absence of a value occurs entirely by chance, and there is no relationship between the missing data and any other variable in the dataset. In other words, the missingness does not depend on the observed or unobserved data.
For example, if some values in a dataset of employee records are missing due to typographical errors made during data entry, and these errors have no correlation with any of the other data points (like age, department, or salary), the missing data is MCAR.
Implication for Handling MCAR:
- The absence of values can be ignored without causing bias in the data, meaning that the missing data can be removed (through listwise deletion) without affecting the overall analysis significantly.
- Techniques such as mean imputation or removing the rows with missing data may work well in this case, as the missingness does not impact other variables.
B. Missing at Random (MAR)
In the case of Missing at Random (MAR), the likelihood of data being missing is related to other observed (non-missing) variables in the dataset, but not to the values of the missing data itself. This means that there is a pattern to the missingness, but the missingness is not related to the specific value that is missing.
For example, imagine a dataset where income data is missing for people in certain age groups. The fact that the income is missing might depend on the age group, but it is not related to the specific income value itself.
Implication for Handling MAR:
- MAR can still be managed using imputation techniques, such as regression imputation or multiple imputation, where the missing data is predicted based on other observed variables in the dataset.
- This requires identifying the variables that are associated with missingness and using them to estimate the missing values.
C. Not Missing at Random (NMAR)
When data is Not Missing at Random (NMAR), the probability of missing data is directly related to the value of the missing data itself. In other words, the missingness is not random, and the fact that data is missing is systematically related to the value that is missing.
For example, in a survey about income, wealthier participants might be less likely to report their income, leading to a situation where the probability of missing income data depends on the income value itself (i.e., high-income individuals are more likely to leave this field blank).
Implication for Handling NMAR:
- Handling NMAR is the most challenging, as imputing missing values based on observed data might introduce bias into the analysis.
- One approach to handle NMAR is to use model-based techniques that can account for the underlying relationships in the data, or to conduct sensitivity analyses to assess how the handling of missing data might affect the results.
- In some cases, missingness indicators (binary variables representing whether the data is missing) can be introduced to capture the effect of missingness itself.
2. Why is Missing Data Important to Address?
In the world of data science and machine learning, missing data is a pervasive issue that can have a profound impact on the performance of models, the quality of analysis, and the accuracy of predictions. Although it might seem like an innocent issue, ignoring or improperly handling missing data can lead to several serious consequences, such as biased results, inaccurate models, and reduced statistical power. Therefore, addressing missing data appropriately is crucial to ensuring that machine learning models are trained on reliable, high-quality data.
Here, we explore in detail why it is important to address missing data in a dataset, with a focus on its potential effects:
A. Bias in the Data Analysis
One of the most significant risks associated with missing data is the bias it can introduce into the dataset. When data is missing, especially Not Missing at Random (NMAR) or Missing at Random (MAR), it can systematically affect the relationship between variables. If the missing data is correlated with other observed data points or with the missing values themselves, this can distort the underlying patterns in the data.
Types of Bias from Missing Data:
- Selection Bias: If the missing data is related to the outcome variable, certain groups or types of data might be systematically excluded from the analysis, leading to biased conclusions. For example, if individuals with higher incomes are less likely to report their income in a survey, excluding those observations can lead to underrepresentation of wealthier individuals in the dataset.
- Estimation Bias: When the missing data is not accounted for properly, any statistical or machine learning estimates derived from the data might be inaccurate. For instance, if missing data points are discarded or imputed incorrectly, the resulting estimates might be skewed or misrepresent the true population values.
Consequences of Bias:
Bias introduced by missing data can lead to misleading conclusions, whether in predictive modeling, statistical analysis, or data exploration. The predictive model may learn incorrect patterns, which could significantly affect decision-making, forecasting, and the overall quality of the analysis.
B. Inaccurate Models
Most machine learning algorithms are designed to process complete, structured datasets without any missing values. Many algorithms cannot handle missing data directly and will either produce errors or fail to generate predictions when faced with missing values in the input dataset. This can severely affect the model’s ability to learn from the data, leading to inaccurate models that fail to capture the true underlying relationships between the variables.
Algorithms Affected by Missing Data:
- Linear Regression: Linear regression models cannot handle missing data, and removing rows with missing values can reduce the dataset size, potentially losing critical information. This could result in an inaccurate representation of the relationships between independent and dependent variables.
- Decision Trees: Decision tree algorithms are also vulnerable to missing data, as they rely on splitting features at each node. Missing data can interfere with the ability to accurately split the data, leading to biased or incomplete trees.
- K-Nearest Neighbors (KNN): KNN algorithms calculate distances between data points. Missing values can distort distance calculations, leading to inaccurate classification or regression results.
Consequences of Inaccurate Models:
If missing data is not addressed properly, the resulting models might:
- Perform poorly, with higher error rates in prediction tasks.
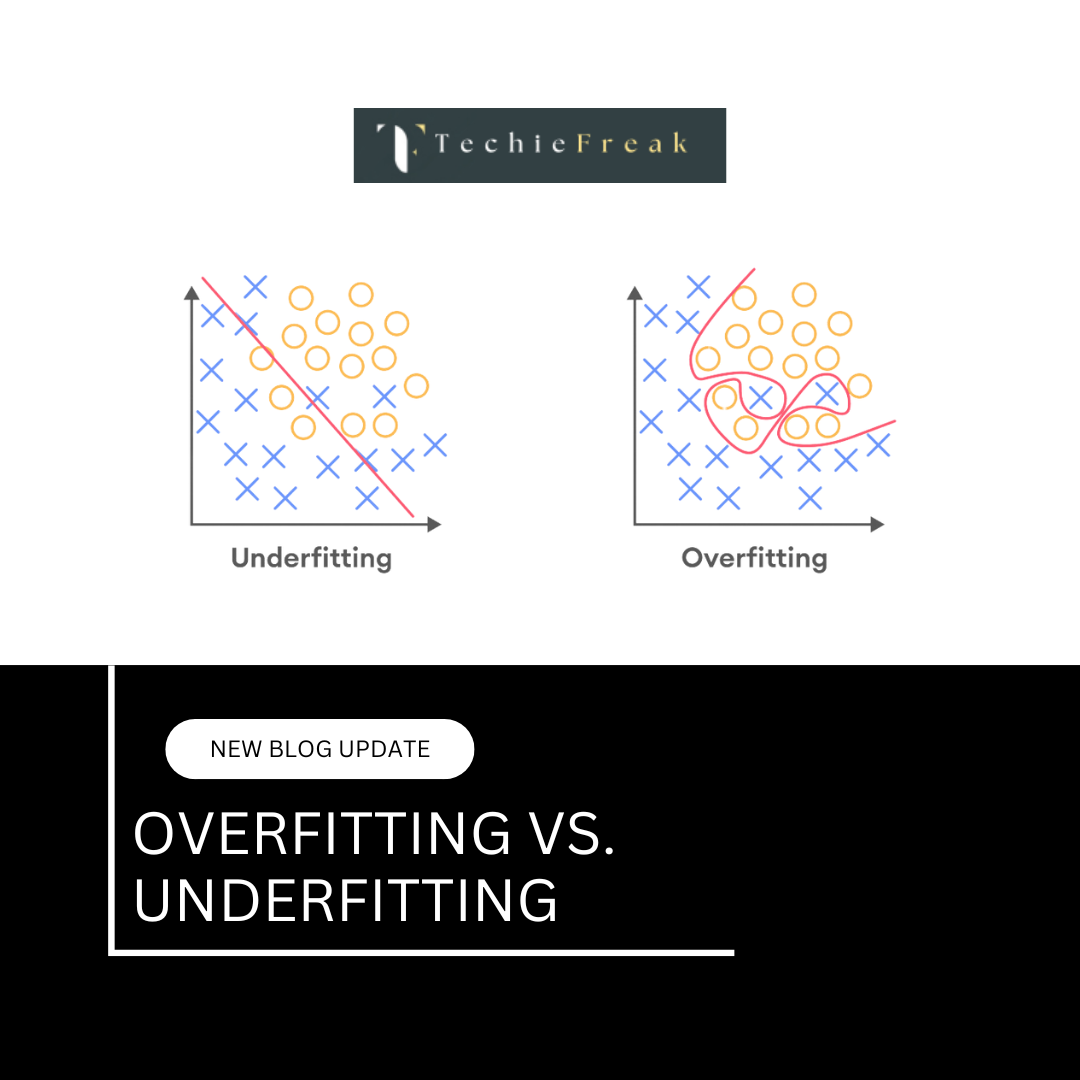
- Overfit or underfit the data, meaning the model may either be too specific (overfitting) or fail to capture important patterns (underfitting).
- Fail to generalize well to unseen data, reducing its ability to make reliable predictions on real-world scenarios.
Thus, handling missing data through imputation, data cleaning, or other methods ensures that the machine learning algorithms can function properly and produce accurate models.
C. Reduced Statistical Power
Statistical power refers to the ability of a statistical test to detect a true effect or relationship when it exists. When there is missing data, the total number of available observations is reduced, which in turn diminishes the statistical power of the analysis. This means that it becomes more difficult to detect meaningful patterns, relationships, or effects in the data.
Consequences of Reduced Statistical Power:
- Inability to Detect True Relationships: Missing data can prevent the detection of important relationships between variables. For example, in a study on the impact of education level on income, missing data could obscure a meaningful relationship between these variables, leading to the false conclusion that there is no effect.
- Increased Variability in Estimates: The lack of complete data increases variability in statistical estimates, as the model has fewer observations to work with. This can lead to less precise estimates of the parameters and increase the margin of error.
- Higher Type I and Type II Errors: In hypothesis testing, missing data can lead to increased rates of Type I errors (false positives) and Type II errors (false negatives). For example, a significant relationship might be missed because the missing data reduced the sample size, or the model might incorrectly identify a relationship that does not actually exist.
The reduction in statistical power due to missing data ultimately undermines the ability of data scientists to make informed, reliable decisions based on the data.
D. Loss of Valuable Information
When missing data is ignored or improperly handled (e.g., by removing entire rows with missing values), a significant amount of valuable information can be lost. This is particularly problematic when the dataset is small or when the missing data contains important insights that could help refine the model or analysis.
Consequences of Information Loss:
- Loss of Important Features: Some features might be more important for the analysis than others. If data from these important features is missing and removed or incorrectly imputed, the analysis may not be able to fully capture the critical aspects of the data.
- Reduction in Dataset Size: Removing rows with missing values reduces the total sample size, which can be especially detrimental when the dataset is already small. Smaller sample sizes increase the variance of model estimates and lead to less reliable conclusions.
E. Complicating Model Interpretation
When missing data is not handled correctly, the model becomes more difficult to interpret. This is particularly true in complex models like ensemble methods, neural networks, or deep learning models, where the relationships between variables may not be immediately clear. Missing data can obscure these relationships, leading to a less transparent model.
Consequences of Complicated Model Interpretation:
- Uncertainty in Feature Importance: If missing values affect certain features disproportionately, it can be challenging to accurately determine which features are the most important predictors for the target variable.
- Interpretability Issues: Missing data can introduce noise or distort the true signal in the data, making it harder to explain the model's decisions and predictions.
3. Common Techniques for Handling Missing Data
There are several strategies to deal with missing data, and the choice of method depends on the nature of the data and the amount of missingness. Below, we’ll discuss the most common approaches to handle missing data.
a. Removing Data
One of the simplest approaches for handling missing data is to remove the rows or columns with missing values. This method works well when the amount of missing data is small and does not affect the overall dataset significantly.
- Remove Rows: If a row has one or more missing values but the information it contains is not critical, the entire row can be discarded. This is often done when there are just a few missing values in a large dataset.
- Remove Columns: If an entire column is filled with missing data, it might be best to remove the column altogether, especially if the feature is not crucial for the analysis.
Advantages:
- Simple and quick.
- Prevents the model from being trained on unreliable or incomplete data.
Disadvantages:
- Loss of information: Removing too many rows or columns can result in the loss of valuable data.
- If missing data is substantial, removing rows or columns can shrink the dataset, potentially affecting model accuracy.
b. Imputation
Imputation is the process of filling in the missing values with estimated ones based on the available data. This technique preserves the size of the dataset and ensures that no data is lost.
i. Mean/Median/Mode Imputation
For numerical data, the mean or median of the observed values can replace the missing ones:
- Mean Imputation: The mean is the average of all observed values for a feature.
- Median Imputation: The median is the middle value of the observed data when sorted in order. Median imputation is especially useful when the data is skewed because it is less sensitive to outliers than the mean.
For categorical data, the mode (most frequent category) is often used to replace missing values.
Example: If the feature "age" is missing in some rows, the missing values can be replaced with the average or median age in the dataset. Similarly, for the "gender" feature, missing values can be filled with the most common gender.
ii. K-Nearest Neighbors (KNN) Imputation
KNN imputation works by filling in missing values based on the values of similar rows (neighbors). It finds the K nearest neighbors (rows with similar feature values) and imputes the missing value based on the weighted average of the neighbors' values.
iii. Regression Imputation
In this technique, missing values for a specific feature are predicted using a regression model based on other available features. For instance, if the "income" feature is missing for some rows, a regression model using "education level" and "age" might be built to predict the missing income values.
iv. Multiple Imputation
Multiple imputation involves creating multiple datasets with different imputed values, analyzing each one separately, and combining the results. This approach accounts for uncertainty in the imputed values and helps provide more accurate results.
v. Forward and Backward Fill
This technique is commonly used in time-series data. Forward fill replaces missing values with the most recent value available, while backward fill uses the next available value.
Advantages:
- Preserves data integrity and dataset size.
- Imputation can be done using relatively simple methods (e.g., mean, median) or more sophisticated ones (e.g., KNN, regression).
Disadvantages:
- Imputation may introduce bias or distort relationships between variables if not handled properly.
- Some methods, like mean imputation, might not capture complex patterns or relationships in the data.
c. Predictive Modeling
This technique uses machine learning models to predict missing values. Predictive models like decision trees, random forests, or even neural networks can be trained to predict missing values based on other features. For example, a decision tree model can predict missing values in the "salary" feature based on available information like age, experience, and job title.
Advantages:
- Can be very accurate, especially if there is a strong correlation between the features and the missing data.
- Suitable for large datasets and complex relationships.
Disadvantages:
- Computationally expensive and may require a lot of resources.
- Requires expertise to choose and tune the right predictive model.
d. Using Indicator Variables
Sometimes, missingness itself is informative. You can create a binary indicator variable (0 for missing, 1 for non-missing) that indicates whether the data is missing. This method is useful when the fact that data is missing may have a relationship with the target variable. For instance, if a customer has missing data on their income, the missingness might indicate something about their profile, such as their socio-economic status.
Advantages:
- Helps capture missingness patterns that may be important.
- Works well when missing data has a specific meaning or relationship to the outcome.
Disadvantages:
- This method does not fill in the actual missing values, but instead treats missingness as a separate feature.
- Not all types of data benefit from this method.
4. Advanced Techniques and Considerations
Handling missing data is not always straightforward. Depending on the nature of the data, the type of machine learning model being used, and the domain in which the data is being analyzed, the strategies for dealing with missing values can vary. While basic methods such as deletion and mean imputation are commonly used, there are more advanced techniques and considerations that can ensure more effective handling of missing data.
In this section, we will explore domain knowledge, visualizing missing data, and the importance of avoiding over-imputation. These aspects play a critical role in choosing the right approach for dealing with missing data and can have a significant impact on the quality of the data and, consequently, the performance of machine learning models.
A. Domain Knowledge
One of the most important aspects of handling missing data is the application of domain knowledge. Understanding the context in which the dataset has been collected is crucial for making informed decisions about how to handle missing data. The treatment of missing values should not be purely algorithmic; it should take into account the nature of the data and the specific requirements of the domain.
Why Domain Knowledge Matters:
- Contextualizing Missing Data: The domain context can provide insights into why certain data points are missing and whether they can be imputed or need to be excluded. For example, in a medical dataset, missing data for a feature like age may be critical, whereas missing data on height might not significantly affect the model’s performance. In medical datasets, age is likely a crucial variable, and its absence should be treated carefully, perhaps with domain-specific imputation techniques like using the average age of patients with similar conditions.
- Deciding on Imputation or Deletion: In some domains, missing values may imply an inherent absence of information that should not be filled in. For example, if data is missing for an income variable in a dataset of tax records, filling that value might introduce inaccurate estimates. Conversely, in consumer behavior studies, missing data on features like purchases might be imputed based on other similar user data.
- Custom Imputation Techniques: Domain knowledge can help in crafting customized imputation techniques. For instance, in a medical setting, missing data in the form of test results might be best handled using regression imputation, where the missing values are predicted based on related test results.
Example:
Consider a dataset of patients with chronic diseases. Missing values for the variable treatment method might reflect non-reporting in cases where the treatment does not apply or has not been prescribed. Domain experts can help determine if this data should be imputed with a typical treatment option for that condition or if the absence of data should be marked differently.
B. Visualizing Missing Data
Before deciding on the appropriate technique for handling missing data, it's helpful to visualize the missingness pattern in the dataset. Understanding how missing data is distributed across features and whether the missingness is random or structured can provide valuable insights for selecting an appropriate treatment strategy.
Tools for Visualizing Missing Data:
- Missingno: One of the most popular Python libraries for visualizing missing data is missingno. It provides several useful plots to help understand the missing data pattern:
- Missing Data Matrix: This plot shows the presence or absence of data in a matrix format, allowing you to see which rows and columns have missing values.
- Bar Plot: It shows the count of missing data in each feature, helping to identify which features have the most missing values.
- Heatmap: This plot visualizes correlations between missingness across different variables. It can help identify patterns in missing data that might suggest the underlying mechanism (e.g., missing at random, missing not at random).
- Dendrogram: It groups variables based on the similarity in their missingness patterns, offering insights into how the missing data relates across features.
- Pandas and Matplotlib: Besides specialized libraries like missingno, pandas and matplotlib can also be used to generate simple visualizations of missing data, such as plotting missing values in a dataset using heatmaps or histograms.
Why Visualizing Missing Data is Useful:
- Identifying Patterns: By visualizing missingness, it becomes easier to detect if the missing data follows any patterns. For example, if certain variables have missing values only in specific segments of the dataset (e.g., certain demographic groups), this might indicate Missing Not at Random (MNAR), suggesting a need for more sophisticated imputation methods.
- Improving Data Imputation Strategy: Visualizing missing data patterns can guide your imputation strategy. For instance, if you notice that data for certain columns is missing for particular rows in the dataset (e.g., missing "salary" for younger employees), it might be appropriate to impute the missing values based on other features like age or job title.
Example:
If you are working with a customer satisfaction survey dataset and notice that responses to certain questions are missing more frequently for certain demographic groups (e.g., younger customers), you may choose to impute the missing data for these customers using other features such as their location, purchase history, or other demographic data.
C. Avoid Over-Imputation
While imputation is a common strategy for handling missing data, it’s important to avoid over-imputation, where too many missing values are imputed without proper validation or consideration. Over-imputation can lead to overfitting and result in a model that is biased or less generalizable.
What is Over-Imputation?
Over-imputation occurs when missing data is filled in excessively, especially in cases where there is significant uncertainty about the missing values. It often involves imputing missing values with the assumption that the imputation method is perfect, which is rarely the case in real-world datasets.
- Overfitting Risk: When missing values are filled too precisely, it can cause the model to overfit to the imputed values. The model will learn to rely on the imputed data instead of the true data, leading to poor performance on new, unseen data.
- Bias Introduction: If the imputation method itself introduces bias (e.g., filling missing values with the mean, when the distribution is skewed), this can lead to biased estimates and predictions. The imputed data might not reflect the true underlying patterns in the dataset, which can distort the results.
- Uncertainty in Imputation: Imputation methods like mean imputation, regression imputation, or k-nearest neighbors rely on assumptions about the missing data. These assumptions might not always hold true, and imputation can add a layer of uncertainty to the analysis.
How to Avoid Over-Imputation:
- Limit Imputation: Try to only impute missing data in situations where it is likely that the missing values can be reasonably estimated using other information in the dataset.
- Imputation Validation: If possible, validate the imputed values by testing the model performance on a subset of data where missing values were artificially introduced. This can help you assess the quality of the imputation method and its impact on model performance.
- Use Multiple Imputation: For datasets with significant missing data, multiple imputation can be used. This technique imputes missing data several times, creating multiple datasets with different imputed values. This reduces the risk of overfitting by acknowledging the inherent uncertainty in the imputation process.
Example:
In a financial dataset where some records are missing salary information, imputing the missing salary values by taking the average salary across the dataset may be an oversimplification. This imputation would not account for variations in salary by department or role. Instead, a more nuanced approach might involve regression imputation, where salary is predicted based on related variables like job title and experience.
5. Tools and Libraries for Missing Data
Handling missing data effectively requires the right tools and libraries to implement the most appropriate techniques for imputation, visualization, and overall data preprocessing. In Python, several libraries offer robust functions to deal with missing data, from basic methods like filling in the mean value to more advanced techniques like matrix factorization. Below, we’ll explore some of the key libraries and their specific functions used to address missing data.
A. Pandas
Pandas is one of the most commonly used Python libraries for data manipulation and analysis. It provides easy-to-use data structures and data analysis tools, including functions specifically designed to handle missing data.
Key Functions for Handling Missing Data in Pandas:
- fillna(): This function is used to fill missing values in a DataFrame or Series. The fillna() method allows for a variety of imputation strategies, such as:
- Constant Value: You can replace missing values with a constant (e.g., replacing missing values with 0 or another value).
- Mean/Median: Replace missing values with the mean or median of a column. This is useful when the data distribution is relatively normal or symmetric.
- Forward Fill (ffill): This method propagates the last valid value to fill subsequent missing values.
- Backward Fill (bfill): Similar to forward fill but fills missing values using the next valid observation.
- dropna(): This function removes any rows or columns that contain missing data. It’s a quick way to eliminate incomplete data but can result in loss of information, especially when a large proportion of the dataset has missing values.
- isna() / isnull(): These methods are used to check for missing data in a DataFrame or Series. They return a boolean mask indicating where the missing values are located.
Example:
import pandas as pd

# Creating a DataFrame with missing values
data = {'Age': [22, None, 25, 28, None],
        'Salary': [35000, 40000, None, 45000, 50000]}
df = pd.DataFrame(data)

# Fill missing values in 'Age' with the mean
df['Age'] = df['Age'].fillna(df['Age'].mean())

# Forward fill missing values in 'Salary'
df['Salary'] = df['Salary'].fillna(method='ffill')

print(df)
Pandas’ fillna() function is extremely flexible, allowing users to apply various imputation methods based on the nature of the data and the analysis.
B. Scikit-learn
Scikit-learn is one of the most widely used libraries for machine learning and provides two powerful imputation classes specifically designed to handle missing data: SimpleImputer and KNNImputer.
SimpleImputer:
- The SimpleImputer class is used to impute missing values in a dataset with a specified strategy. It is a quick and easy way to handle missing values, and it supports both numerical and categorical data.
- Common strategies include:
- mean: Imputes missing values using the mean of the column.
- median: Imputes using the median, which is more robust to outliers than the mean.
- most_frequent: Replaces missing values with the most frequent value in the column (useful for categorical data).
- constant: Replaces missing values with a constant value.
KNNImputer:
- The KNNImputer class uses the K-nearest neighbors algorithm to impute missing values based on the values of the nearest neighbors.
- It works by finding the k nearest data points for each missing value and then imputing the missing value as the mean (or another metric) of those neighbors.
Example:
from sklearn.impute import SimpleImputer, KNNImputer
import pandas as pd

# Creating a DataFrame with missing values
data = {'Age': [22, None, 25, 28, None],
        'Salary': [35000, 40000, None, 45000, 50000]}
df = pd.DataFrame(data)

# Using SimpleImputer for mean imputation on 'Age'
imputer = SimpleImputer(strategy='mean')
df['Age'] = imputer.fit_transform(df[['Age']])

# Using KNNImputer for 'Salary'
knn_imputer = KNNImputer(n_neighbors=2)
df['Salary'] = knn_imputer.fit_transform(df[['Salary']])

print(df)
Scikit-learn provides powerful and flexible imputation methods that can be fine-tuned for both numerical and categorical data.
C. FancyImpute
FancyImpute is a Python package that offers several advanced imputation techniques. It extends the functionality of basic imputation methods by introducing more sophisticated algorithms that can be particularly useful for complex datasets with significant missingness.
Key Imputation Techniques in FancyImpute:
- KNN (K-Nearest Neighbors) Imputation: This technique imputes missing values based on the k nearest neighbors in the dataset, similar to Scikit-learn's KNNImputer, but with more customization options.
- MICE (Multiple Imputation by Chained Equations): MICE is a robust method that imputes missing data by modeling each feature with missing values as a function of other features in the dataset. It runs multiple iterations (or chains) to improve the imputation accuracy.
- Matrix Factorization: Matrix factorization techniques like NMF (Non-negative Matrix Factorization) can be used to approximate missing values by decomposing the data matrix into lower-dimensional matrices, thus predicting missing values more accurately.
Example:
from fancyimpute import KNN, IterativeImputer
import pandas as pd

# Creating a DataFrame with missing values
data = {'Age': [22, None, 25, 28, None],
        'Salary': [35000, 40000, None, 45000, 50000]}
df = pd.DataFrame(data)

# Using KNN imputation from FancyImpute
knn_imputer = KNN(k=3)
df_imputed_knn = knn_imputer.fit_transform(df)

# Using MICE imputation from FancyImpute
mice_imputer = IterativeImputer()
df_imputed_mice = mice_imputer.fit_transform(df)

print(df_imputed_knn)
print(df_imputed_mice)
FancyImpute provides more advanced imputation strategies, such as MICE, which can be especially useful when the data is missing in a complex and systematic manner. These techniques are better suited for datasets where simple imputation strategies may not be sufficient.
D. MissForest
MissForest is a machine learning-based imputation method that uses a random forest algorithm to predict missing data. This non-parametric imputation technique is particularly useful for datasets where the relationships between variables are complex and not easily captured by traditional imputation methods.
How MissForest Works:
- MissForest iteratively imputes missing data by training a random forest model on the observed (non-missing) values. It then uses the predictions from the random forest model to fill in the missing values.
- The algorithm works well for both numerical and categorical data and can capture complex relationships between variables.
Advantages of MissForest:
- Non-parametric: MissForest doesn’t make assumptions about the distribution of the data, making it a flexible and powerful technique.
- Iterative: The iterative nature of the algorithm helps in refining the imputed values with each pass.
Example:
from missforest import MissForest
import pandas as pd

# Creating a DataFrame with missing values
data = {'Age': [22, None, 25, 28, None],
        'Salary': [35000, 40000, None, 45000, 50000]}
df = pd.DataFrame(data)

# Using MissForest for imputation
imputer = MissForest()
df_imputed = imputer.fit_transform(df)

print(df_imputed)
MissForest is particularly beneficial when you want to impute missing values while preserving the underlying relationships between variables. It’s a powerful tool for more complex data imputation tasks.
Key Takeaways
Data cleaning and handling missing data is a crucial step in the machine learning pipeline. The quality of the data directly affects the quality of the model. By employing various strategies like data removal, imputation, predictive modeling, and using indicator variables, you can ensure that your machine learning models are trained on clean, complete, and reliable datasets.
It’s important to remember that there is no one-size-fits-all solution. The method chosen to handle missing data should be based on the data type, the proportion of missing values, and the underlying distribution. By carefully selecting the appropriate technique, you can significantly enhance the predictive performance of your machine learning models and draw more accurate and reliable insights from your data.
Next Topic : Feature Engineering in ML




.png)
.png)
.png)
.png)
.png)
.png)
.png)
.png)
.png)
.png)
.png)
.png)
.png)
.png)
.png)
.png)
.png)
.png)
.png)
.png)
