Model Evaluation in Machine Learning
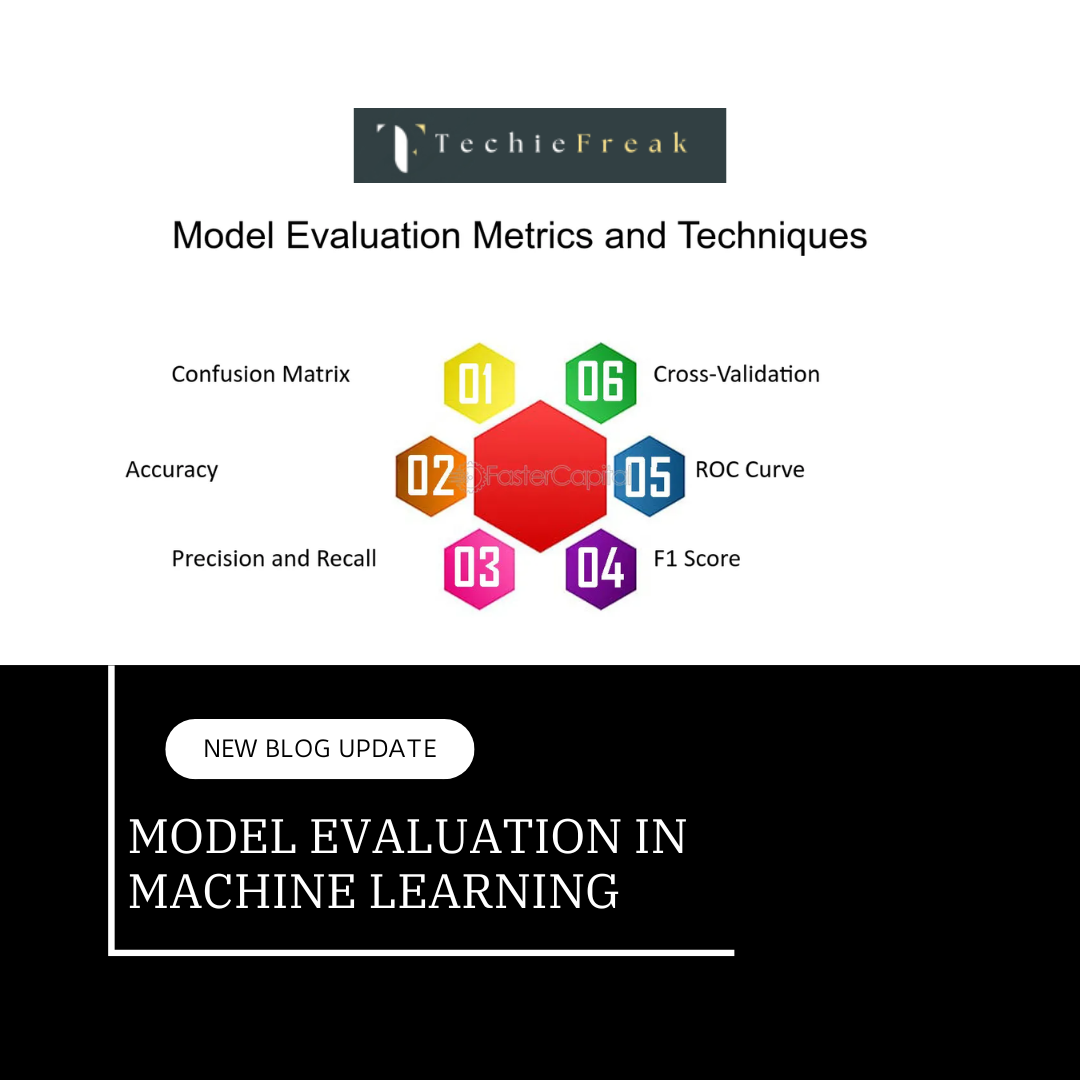
Model evaluation is a crucial step in the machine learning pipeline to ensure the model's reliability, performance, and generalization. Three key techniques used for evaluation are Cross-validation, Confusion Matrix, and the ROC Curve.
1. Cross-Validation
Cross-validation is a statistical method used to assess a model's performance on unseen data. It divides the dataset into training and testing subsets multiple times to reduce bias and variance in evaluation.
How It Works
- The dataset is split into k subsets (folds).
- The model is trained on k−1 folds and tested on the remaining fold.
- This process is repeated k times, with each fold serving as the test set once.
- The final performance metric is the average across all folds.
Types of Cross-Validation
- k-Fold Cross-Validation: Divides data into k equal folds.
- Stratified k-Fold: Ensures class distribution remains consistent across folds.
- Leave-One-Out Cross-Validation (LOOCV): Uses a single data point as the test set and the rest as training.
Advantages
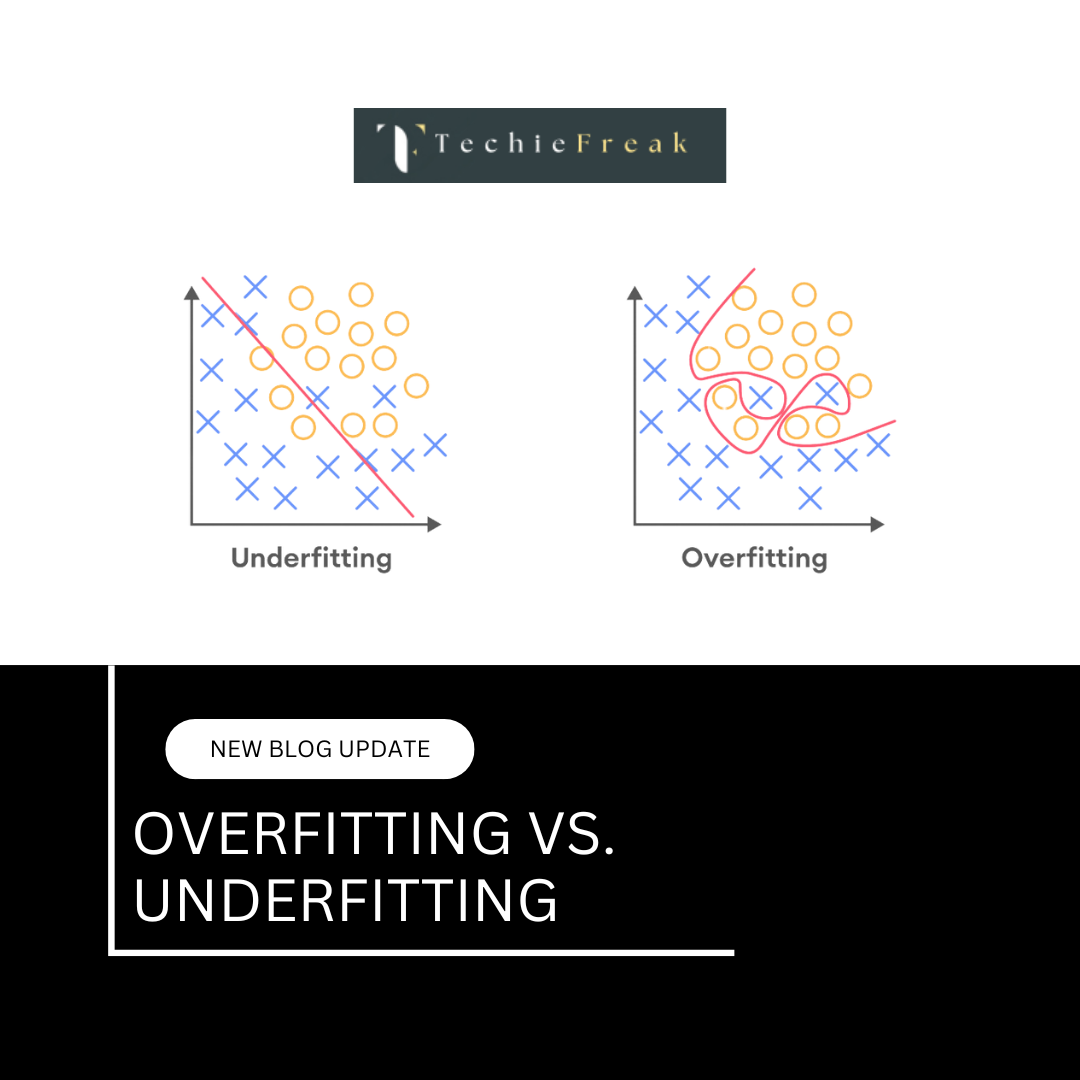
- Reduces the risk of overfitting or underfitting.
- Provides a more reliable estimate of model performance.
Disadvantages
- Computationally expensive for large datasets.
2. Confusion Matrix
A confusion matrix is a tabular summary of model predictions against the actual outcomes in classification tasks. It is particularly useful for evaluating classification models.
Structure of Confusion Matrix
| Predicted Positive | Predicted Negative | |
|---|---|---|
| Actual Positive | True Positive (TP) | False Negative (FN) |
| Actual Negative | False Positive (FP) | True Negative (TN) |
Metrics Derived from Confusion Matrix
Accuracy:

Precision:

Recall (Sensitivity):

F1 Score:

Advantages
- Provides insights into types of errors (e.g., FP and FN).
- Useful for imbalanced datasets.
Limitations
- Does not work well for multi-class problems without adaptation.
- Requires balanced datasets for accurate representation.
3. ROC Curve (Receiver Operating Characteristic Curve)
The ROC curve is a graphical representation of a model's performance across various classification thresholds. It plots the True Positive Rate (TPR) against the False Positive Rate (FPR).
How to Interpret
True Positive Rate (TPR):

False Positive Rate (FPR):

- The curve shows how the model balances sensitivity (recall) and specificity across thresholds.
Area Under the Curve (AUC)
- The area under the ROC curve (AUC) quantifies the model's overall ability to distinguish between classes.
- AUC values range from 0.5 (random guessing) to 1 (perfect classification).
Advantages
- Helps visualize model performance across thresholds.
- Suitable for imbalanced datasets.
Limitations
- Not intuitive for non-binary classification problems.
- Relies on probabilistic outputs, which some models may not provide.
Key Takeaways
Model evaluation ensures that a machine learning model is robust and generalizes well to unseen data. While cross-validation provides a reliable performance estimate, confusion matrices and ROC curves offer detailed insights into classification accuracy and decision-making thresholds. Proper evaluation helps refine models and choose the best-performing one for deployment.
Next Topic- Linear Regression in Machine learning




.png)
.png)
.png)
.png)
.png)
.png)
.png)
.png)
.png)
.png)
.png)
.png)
.png)
.png)
.png)
.png)
.png)
.png)
.png)
.png)
