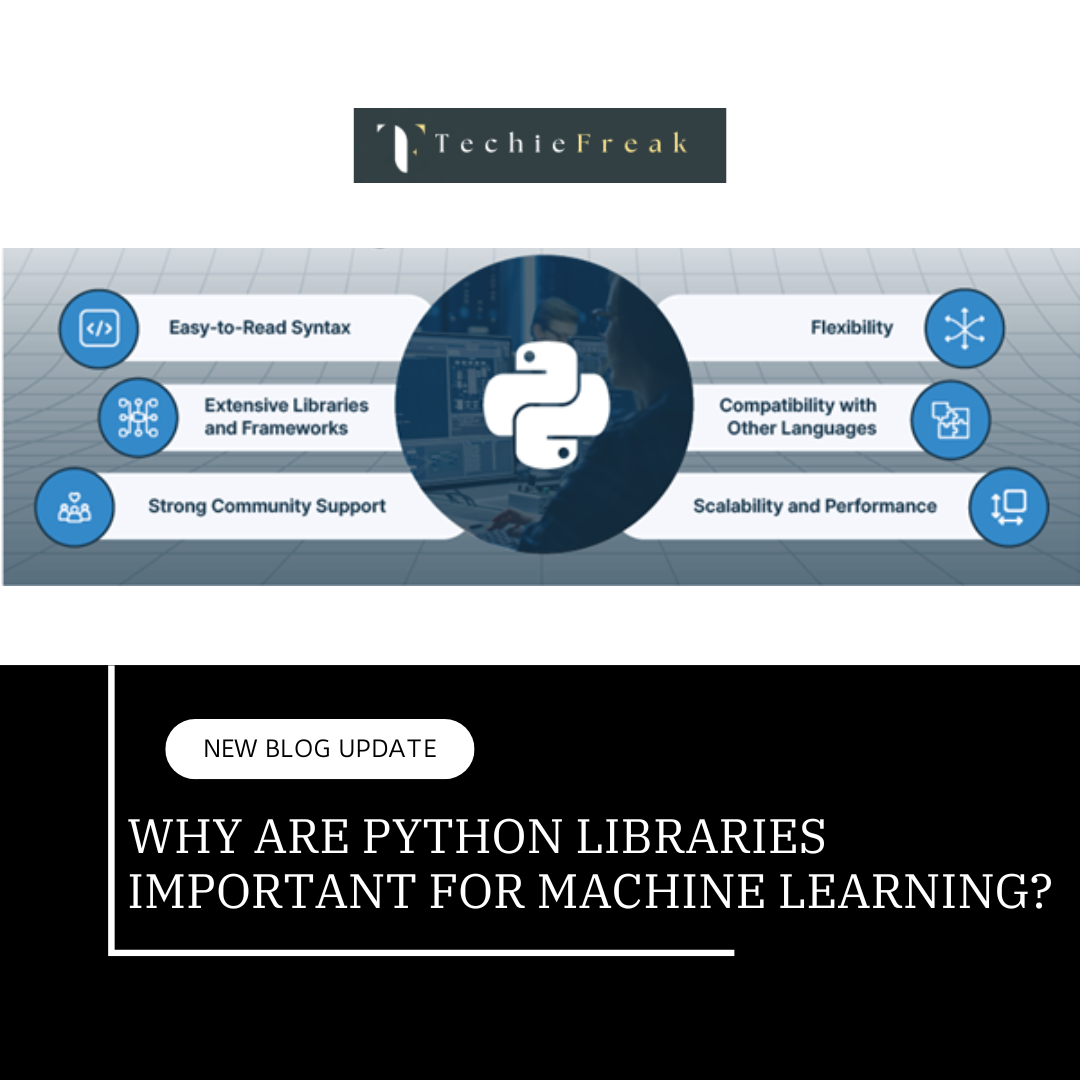
Why Are Python Libraries Important for Machine Learning?
Machine learning (ML) requires extensive operations such as data manipulation, mathematical computations, and visualization. Python libraries simplify these tasks and provide optimized tools for effective implementation.
Key Benefits of Python Libraries for ML
- Pre-built Functions:
- Libraries like NumPy and Pandas include pre-defined methods for operations like linear algebra, data filtering, and statistical analysis.
- Saves time and eliminates the need to write complex algorithms from scratch.
- Efficiency:
- These libraries are optimized for performance, enabling smooth handling of large datasets and computations.
- Example: Operations on NumPy arrays are significantly faster than on native Python lists.
- Community Support:
- Python libraries are open-source, ensuring regular updates, active forums, and bug fixes.
- Libraries like Pandas and NumPy are used globally, making it easy to find resources and examples.
Overview of Key Libraries for Machine Learning
This section introduces the foundational Python libraries for ML, starting with NumPy and Pandas.
A. NumPy: Numerical Python
NumPy is a core library for numerical and scientific computing in Python. It provides an efficient way to work with arrays, matrices, and advanced mathematical functions.
Key Features of NumPy
- Multidimensional Array Support:
- The core of NumPy is its ndarray object, which allows for efficient storage and manipulation of large datasets in multiple dimensions.
- Mathematical Operations:
- Offers functions for linear algebra, statistics, trigonometry, and more.
- Seamless Integration:
- Works seamlessly with other ML libraries like Pandas, Scikit-learn, and TensorFlow.
NumPy Basics
Creating Arrays:
NumPy arrays are faster and more memory-efficient than Python lists.
Advantages:
- Arrays can be indexed and sliced efficiently.
- Supports various operations that are optimized and vectorized.
Example:
import numpy as np

# Creating a 1D array
arr = np.array([1, 2, 3, 4])
print("Array:", arr)  # Output: [1 2 3 4]

# Creating a 2D array (matrix)
matrix = np.array([[1, 2], [3, 4]])
print("Matrix:\n", matrix)
Array Operations:
Perform element-wise operations efficiently.
Example:
# Multiply each element by 2
print(arr * 2)  # Output: [2 4 6 8]

# Add two arrays
arr2 = np.array([5, 6, 7, 8])
print(arr + arr2)  # Output: [ 6  8 10 12]
Matrix Operations:
NumPy provides a powerful set of linear algebra functions that can be used for matrix operations, such as matrix multiplication, inversion, and solving linear systems.
Example:
# Inverse of a matrix
matrix = np.array([[1, 2], [3, 4]])
inverse = np.linalg.inv(matrix)
print("Inverse:\n", inverse)

# Dot product of two matrices
matrix2 = np.array([[2, 0], [1, 2]])
dot_product = np.dot(matrix, matrix2)
print("Dot Product:\n", dot_product)
Key Mathematical Functions:
NumPy provides a wide array of mathematical functions for scientific computing. These include:
Statistical Functions:
- Mean: The average of all elements in the array.
- Standard Deviation: A measure of the spread of data points.
Example:
print("Mean:", np.mean(arr))  # Output: 2.5
print("Standard Deviation:", np.std(arr))  # Output: 1.118033988749895
Trigonometric Functions:
- NumPy supports a range of trigonometric operations, such as sine, cosine, and tangent.
Example:
angles = np.array([0, np.pi/2, np.pi]) print("Sine:", np.sin(angles)) # Output: [0. 1. 0.]- Other Mathematical Functions:
- Exponential: np.exp()
- Logarithm: np.log()
- Square Root: np.sqrt()
- Absolute Value: np.abs()
Advantages:
- Vectorized operations: Instead of writing loops, NumPy allows you to perform calculations on entire arrays at once, reducing the need for explicit loops and improving performance.
- Comprehensive library: Provides almost every common mathematical function you might need for scientific computing.
NumPy
| Function/Attribute | Use |
|---|---|
| array() | Creates an array object. |
| reshape() | Reshapes an array without changing its data. |
| arange() | Creates evenly spaced values within a given range. |
| linspace() | Generates evenly spaced numbers over a specified range. |
| random.rand() | Generates random numbers from a uniform distribution. |
| random.randn() | Generates random numbers from a normal distribution. |
| mean() | Calculates the mean of array elements. |
| std() | Calculates the standard deviation of array elements. |
| sum() | Calculates the sum of all elements in an array. |
| dot() | Performs dot product of two arrays. |
| transpose() | Returns the transpose of an array. |
| concatenate() | Joins two or more arrays along an axis. |
B. Pandas: Data Manipulation Made Easy
Pandas is an essential library for data manipulation and analysis. It provides two primary data structures:
- Series: A 1-dimensional labeled array.
- DataFrame: A 2-dimensional labeled tabular structure (rows and columns).
Key Features of Pandas
- Data Wrangling and Transformation:
- Clean and restructure raw data for analysis.
- Multiple File Formats:
- Easily import/export data in CSV, Excel, JSON, and SQL formats.
- Handling Missing Data:
- Fill, replace, or drop missing values in datasets.
Pandas Basics
Creating DataFrames:
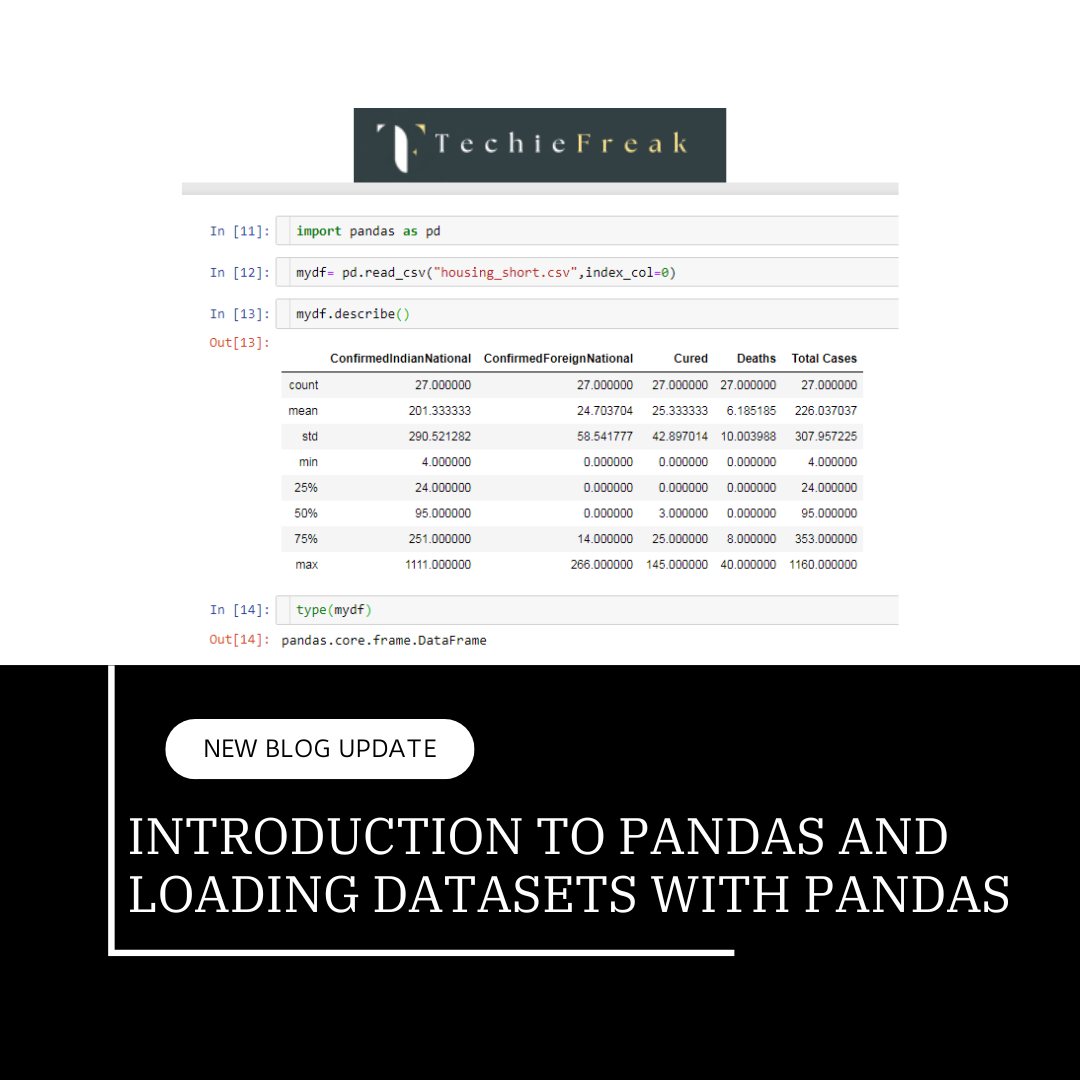
_1735034631.png)
DataFrames are the core data structure in Pandas, used to store tabular data (i.e., rows and columns). You can create DataFrames from a variety of sources, such as lists, dictionaries, or CSV files.
A DataFrame is like a table where rows represent records and columns represent variables or features.
Example:
import pandas as pd

# Creating a DataFrame
data = {'Name': ['Alice', 'Bob'], 'Age': [25, 30]}
df = pd.DataFrame(data)
print(df)
Output:
    Name  Age
0  Alice   25
1    Bob   30
Accessing Data:
Once you've created a DataFrame, you can access specific rows, columns, or even individual data points using different methods:
Accessing Columns:
- You can access a single column as a Series (a 1D array-like object).
Example:
print(df['Name']) # Output: Series with namesAccessing Rows:
- To access rows by position (i.e., the index), use iloc[].
Example:
print(df.iloc[0]) # Output: First row as SeriesAccessing Specific Elements:
- Use .at[] or .iat[] to access a specific value at a given row and column.
Example:
print(df.at[0, 'Name']) # Output: 'Alice'
Data Filtering:
Filtering data is a critical aspect of data analysis, as you can extract rows based on specific conditions.
Example:
# Filter rows where Age > 25
filtered = df[df['Age'] > 25]
print(filtered)
Output:
  Name  Age
1 Bob 30 Explanation: The condition df['Age'] > 25 creates a boolean mask, and df[...] selects the rows where the condition is True.
Advanced Pandas Operations
Handling Missing Data:
Data often comes with missing or NaN (Not a Number) values, which must be handled before analysis. Pandas provides tools to fill or drop missing values.
# Fill missing values with a default
df['Age'] = df['Age'].fillna(0)

# Drop rows with missing data
df = df.dropna()
Merging and Joining:
You can combine data from multiple DataFrames using merge or join operations. This is useful when you have data in different tables that you want to link together.
Example:
data1 = {'ID': [1, 2], 'Name': ['Alice', 'Bob']}
data2 = {'ID': [1, 2], 'Score': [85, 90]}
df1 = pd.DataFrame(data1)
df2 = pd.DataFrame(data2)

merged = pd.merge(df1, df2, on='ID')
print(merged)
Output:
   ID   Name  Score
0   1  Alice     85
1   2    Bob     90
GroupBy and Aggregations:
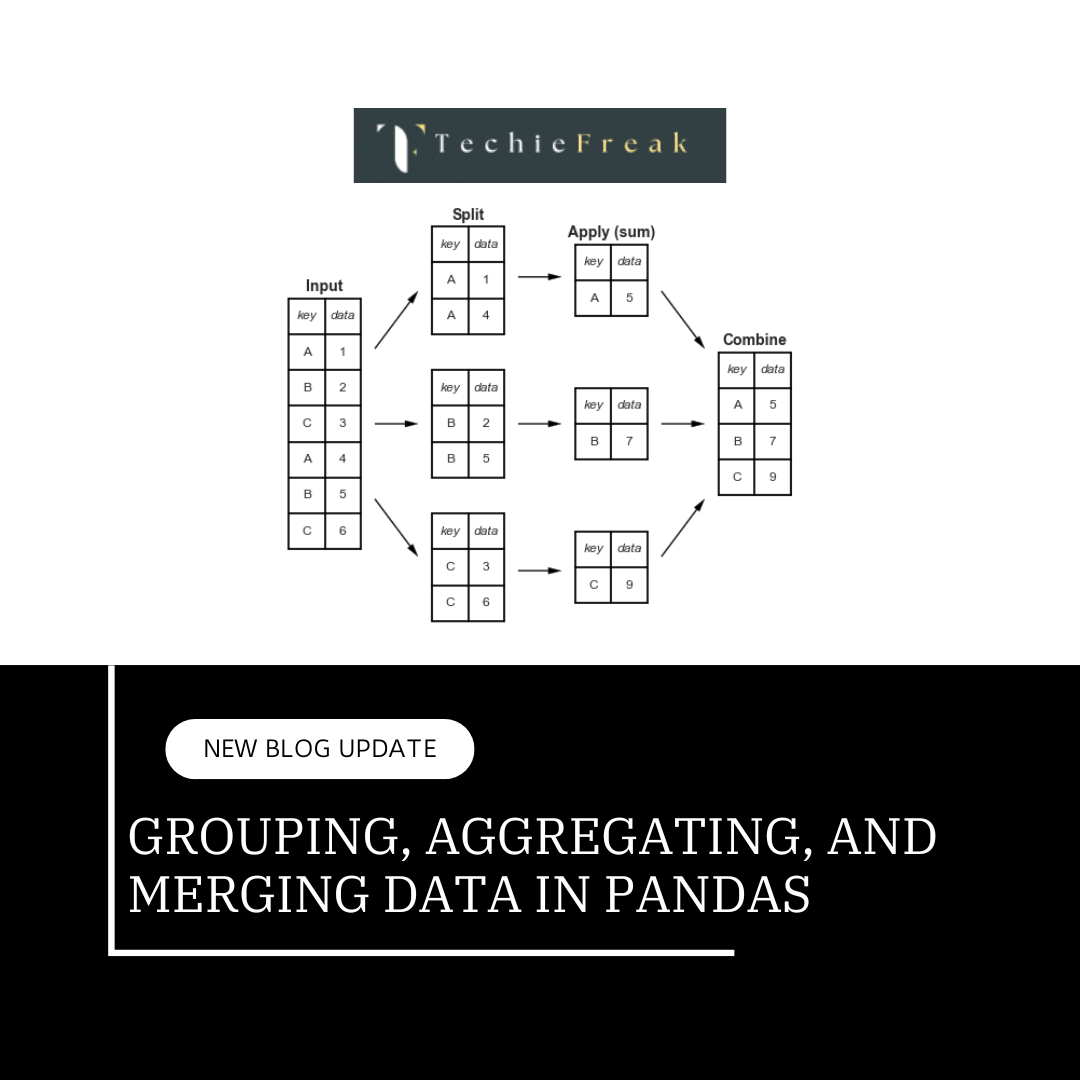
GroupBy allows you to group data based on one or more columns and perform aggregate operations (such as sum, mean, count, etc.) on those groups.
Example:
data = {'Name': ['Alice', 'Bob', 'Alice'], 'Score': [85, 90, 88]}
df = pd.DataFrame(data)

grouped = df.groupby('Name')['Score'].mean()
print(grouped)
Output:
Name
Alice    86.5
Bob      90.0
Name: Score, dtype: float64
Pandas
| Function/Attribute | Use |
|---|---|
| read_csv() | Reads data from a CSV file into a DataFrame. |
| to_csv() | Writes a DataFrame to a CSV file. |
| head() | Displays the first few rows of a DataFrame. |
| tail() | Displays the last few rows of a DataFrame. |
| describe() | Provides statistical summary of numerical columns. |
| info() | Displays concise information about a DataFrame, including data types. |
| merge() | Combines two DataFrames based on a key or multiple keys. |
| groupby() | Groups data for aggregation, transformation, or filtering. |
| isnull() | Detects missing values in the DataFrame. |
| fillna() | Fills missing values with a specified value or method. |
| sort_values() | Sorts DataFrame by the values of a specific column. |
| pivot_table() | Creates a pivot table for summarizing data. |
| loc[] | Accesses rows and columns using labels. |
| iloc[] | Accesses rows and columns using integer indices. |
Key takeaways:
- NumPy:
- Perfect for numerical computations, linear algebra, and array manipulations.
- Essential for mathematical operations in ML.
- Pandas:
- Designed for tabular data manipulation and analysis.
- Makes data cleaning and transformation intuitive and efficient.
Next Blog : Python Libraries -> Matplotlib and Scikit-learn

.png)







.png)
.png)

