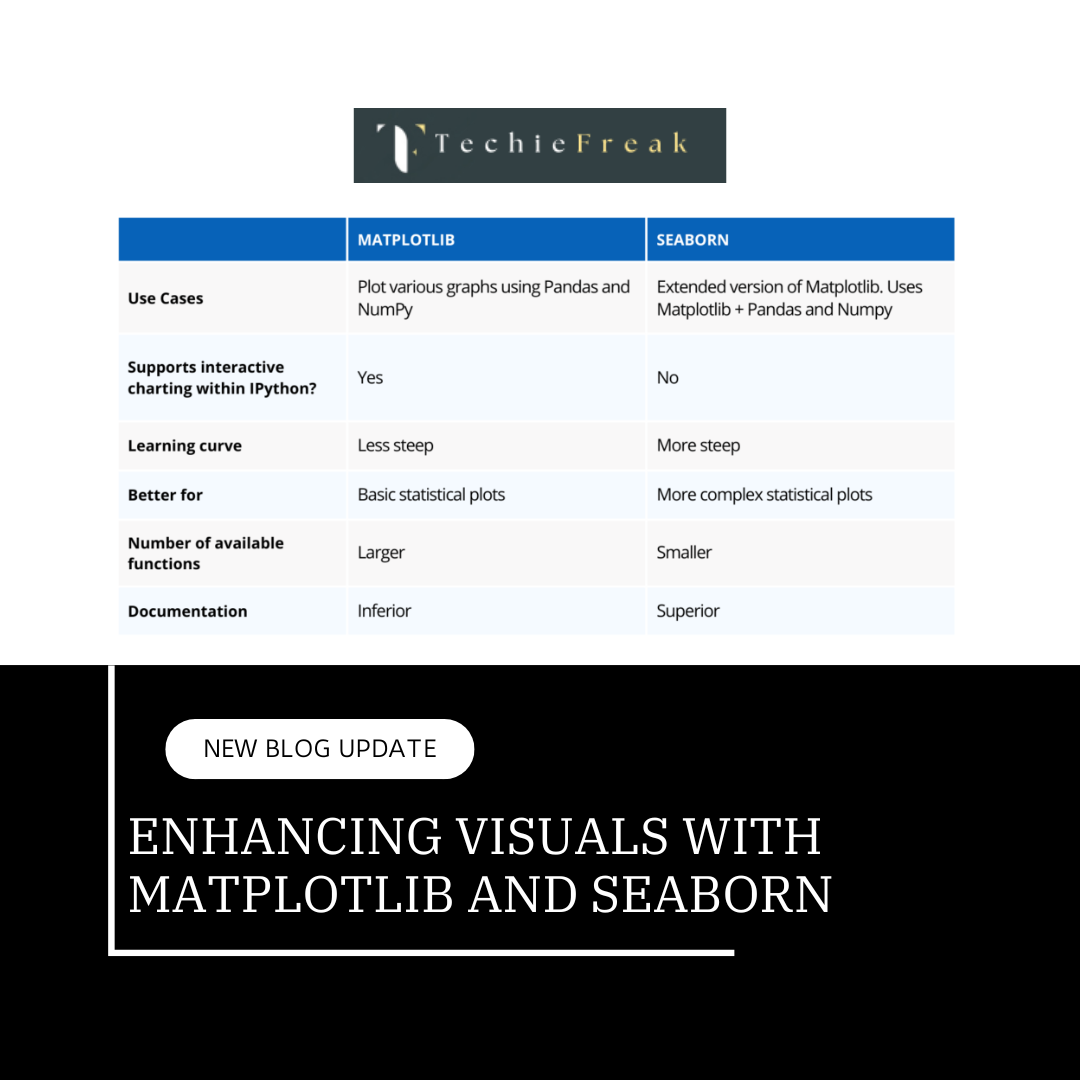
A. Matplotlib: Visualization Simplified
Matplotlib is a powerful Python library used for data visualization.
- It enables the creation of static, interactive, and animated plots to understand data better.
- The library is highly customizable, making it suitable for both basic and advanced plotting.
Key Components of Matplotlib
- Pyplot Module
- The pyplot module is the interface most commonly used for plotting.
- It functions like MATLAB, where plotting commands can be executed step-by-step.
- Import conventionally as: import matplotlib.pyplot as plt.
- Figure
- Represents the entire canvas or "container" for your plots.
- Created using plt.figure().
- Can include one or more subplots.
- Axes and Subplots
- Axes: The actual area where data is plotted, including the X and Y axes.
- Subplot: Multiple plots on a single figure created using plt.subplot() or plt.subplots().
- Artist Layer
- Every element in Matplotlib (lines, text, legends, etc.) is an "Artist."
- Artists are added to the canvas to construct a plot.
Installation:
To use Matplotlib, first install it via pip:
pip install matplotlib
Basic Plotting:
The core of Matplotlib is the pyplot module, typically imported as plt.
Example: Creating a Simple Line Plot
import matplotlib.pyplot as plt

# Data for plotting
x = [1, 2, 3, 4]
y = [10, 20, 25, 30]

# Create a line plot
plt.plot(x, y)

# Add title and labels
plt.title("Line Plot")
plt.xlabel("X-axis")
plt.ylabel("Y-axis")

# Display the plot
plt.show()
Output:
A simple line graph representing the relationship between x and y.
_1735033606.png)
Types of Plots in Matplotlib
1. Bar Charts:
- Used to compare data across categories.
- Vertical bars: plt.bar()
Horizontal bars: plt.barh()
Example:
categories = ['A', 'B', 'C', 'D']
values = [3, 7, 8, 5]

plt.bar(categories, values)
plt.title("Bar Chart")
plt.xlabel("Categories")
plt.ylabel("Values")
plt.show()
_1735033632.png)
2. Histograms:
- Displays the frequency distribution of numerical data.
- Useful for identifying patterns like skewness or normal distribution.
- Created using plt.hist().
Example:
data = [1, 2, 2, 3, 3, 3, 4, 4, 5]

plt.hist(data, bins=5, color='blue', edgecolor='black')
plt.title("Histogram")
plt.xlabel("Bins")
plt.ylabel("Frequency")
plt.show()
_1735033655.png)
3. Scatter Plots:
- Shows relationships or correlations between two variables.
- Created using plt.scatter().
Example:
x = [5, 7, 8, 7]
y = [8, 5, 6, 7]

plt.scatter(x, y, color='red')
plt.title("Scatter Plot")
plt.xlabel("X-axis")
plt.ylabel("Y-axis")
plt.show()
_1735033670.png)
4. Pie Charts:
- Displays proportions as slices of a pie.
- Created using plt.pie().
- Supports customization like labels, colors, and percentage display.
Example:
labels = ['Python', 'Java', 'C++', 'Ruby']
sizes = [40, 30, 20, 10]

plt.pie(sizes, labels=labels, autopct='%1.1f%%')
plt.title("Programming Language Popularity")
plt.show()
Advanced Features
- Subplots: Create multiple plots in one figure.
- Custom Styling: Use plt.style.use() to apply styles like ggplot, seaborn, etc.
Annotations: Add text or markers to emphasize key points in the graph.
Matplotlib
| Function/Attribute | Use |
|---|---|
| plot() | Creates a 2D line plot. |
| scatter() | Creates a scatter plot. |
| bar() | Creates a bar plot. |
| hist() | Creates a histogram. |
| pie() | Creates a pie chart. |
| xlabel() | Sets the label for the X-axis. |
| ylabel() | Sets the label for the Y-axis. |
| title() | Sets the title of the plot. |
| legend() | Displays a legend for the plot. |
| grid() | Adds a grid to the plot. |
| show() | Displays the plot. |
| subplot() | Creates multiple subplots in a single figure. |
| savefig() | Saves the plot as an image file. |
D. Scikit-learn: The ML Workhorse
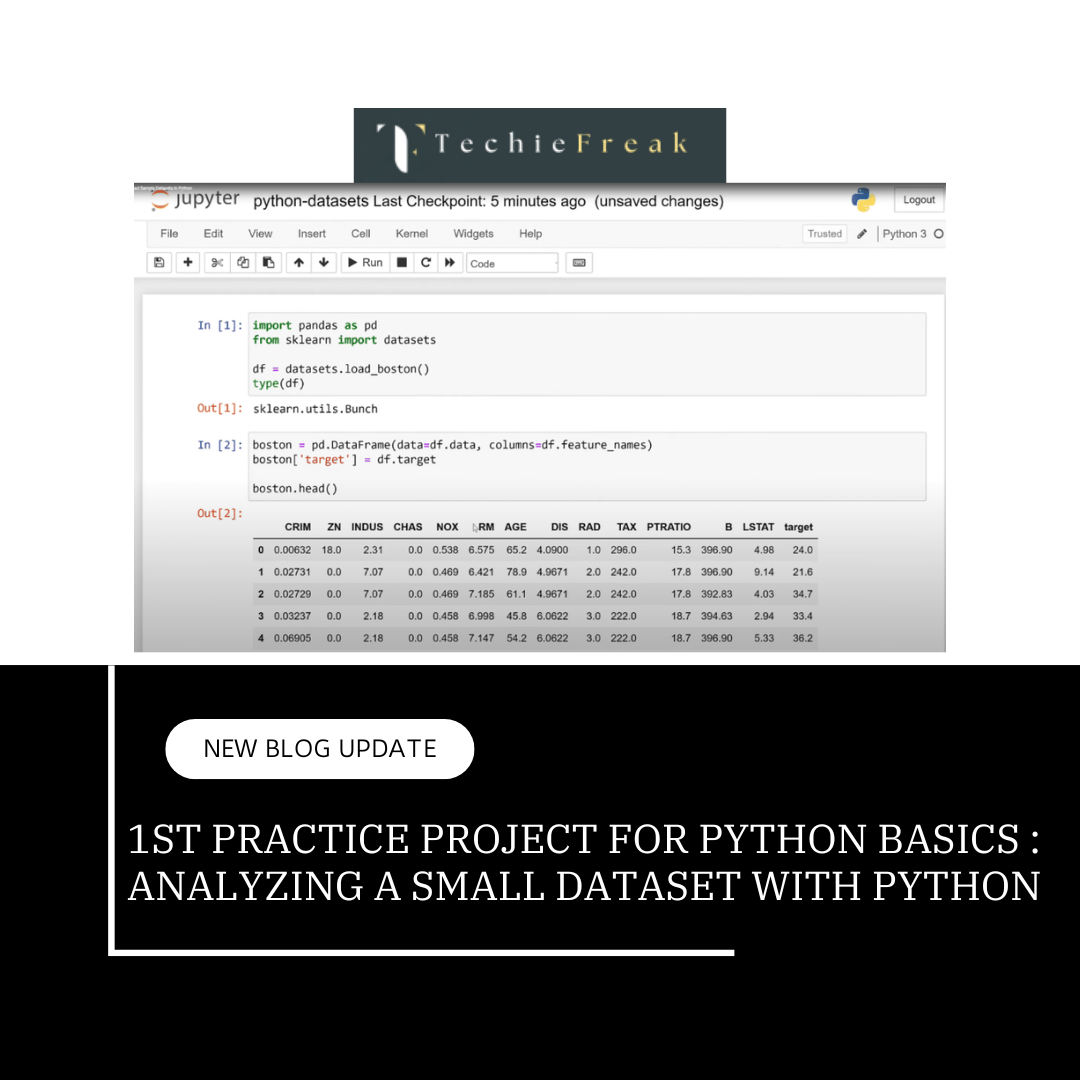
Scikit-learn is a comprehensive library for machine learning, offering tools for data preprocessing, model building, and evaluation. It simplifies the implementation of ML algorithms.
Key Features of Scikit-learn
- Pre-built Algorithms:
- Includes tools for classification (e.g., SVM, Random Forest), regression (e.g., Linear Regression), and clustering (e.g., K-means).
- Data Preprocessing:
- Tools for scaling, normalization, encoding categorical variables, and splitting datasets.
- Model Evaluation:
- Metrics for accuracy, precision, recall, and cross-validation.
Scikit-learn Basics
Installation:
Install Scikit-learn via pip:
pip install scikit-learn
Example: Linear Regression Model
Linear Regression is a basic supervised learning algorithm used for predicting numerical values.
Step-by-Step Implementation:
from sklearn.linear_model import LinearRegression

# Step 1: Prepare the data
X = [[1], [2], [3]]  # Feature data (input)
y = [2, 4, 6]  # Target data (output)

# Step 2: Create the model
model = LinearRegression()

# Step 3: Train the model
model.fit(X, y)

# Step 4: Make predictions
prediction = model.predict([[4]])
print("Prediction for X=4:", prediction)  # Output: [8]
Common ML Algorithms in Scikit-learn
1. Classification:
Classification is a supervised learning technique where the goal is to predict the category or class of given data points.
- Input data is labeled with predefined categories, and the model learns to map inputs to these categories.
Applications:
- Email spam detection (Spam/Not Spam).
- Image recognition (Cat/Dog).
Disease diagnosis (Positive/Negative).
Example: Logistic Regression, Decision Trees.
from sklearn.tree import DecisionTreeClassifier

# Sample data
X = [[0, 0], [1, 1]]
y = [0, 1]

# Train a decision tree classifier
clf = DecisionTreeClassifier()
clf.fit(X, y)

# Predict category
print(clf.predict([[2, 2]]))  # Output: [1]
2. Clustering:
Clustering is an unsupervised learning technique that groups data points into clusters based on their similarity.
- Unlike classification, clustering does not use labeled data.
Applications:
- Customer segmentation in marketing.
- Image compression.
Anomaly detection.
Example: K-means Clustering.
from sklearn.cluster import KMeans

# Sample data
X = [[1, 2], [1, 4], [1, 0], [4, 2], [4, 4], [4, 0]]

# Apply K-means clustering
kmeans = KMeans(n_clusters=2, random_state=0).fit(X)
print("Cluster centers:", kmeans.cluster_centers_)
3. Model Evaluation:
- Model evaluation is the process of assessing a machine learning model’s performance.
It helps determine how well the model generalizes to unseen data.
Key Metrics in Scikit-learn:
- Accuracy Score:
- Measures the ratio of correctly predicted observations to the total observations.
- Suitable for balanced datasets.
- Formula: Accuracy=Number of Correct PredictionsTotal Number of Predictions\text{Accuracy} = \frac{\text{Number of Correct Predictions}}{\text{Total Number of Predictions}}Accuracy=Total Number of PredictionsNumber of Correct Predictions
- Precision, Recall, and F1-Score:
- Precision: Fraction of relevant instances among retrieved instances.
- Recall: Fraction of relevant instances that were retrieved.
- F1-Score: Harmonic mean of precision and recall.
- Confusion Matrix:
- A tabular representation of actual vs. predicted values.
- Helps analyze where the model is making errors.
Example:
from sklearn.metrics import accuracy_score

# True labels and predicted labels
y_true = [0, 1, 1, 0]
y_pred = [0, 1, 0, 0]

accuracy = accuracy_score(y_true, y_pred)
print("Accuracy:", accuracy)  # Output: 0.75
Scikit-learn
| Function/Attribute | Use |
|---|---|
| train_test_split() | Splits data into training and testing sets. |
| fit() | Fits a machine learning model to the training data. |
| predict() | Predicts outputs for given input data using a trained model. |
| accuracy_score() | Computes the accuracy of a classification model. |
| mean_squared_error() | Computes the mean squared error for regression models. |
| StandardScaler() | Standardizes features by removing the mean and scaling to unit variance. |
| PCA() | Performs Principal Component Analysis for dimensionality reduction. |
| KMeans() | Implements K-Means clustering algorithm. |
| cross_val_score() | Evaluates a model using cross-validation. |
| GridSearchCV() | Finds the best hyperparameters using grid search and cross-validation. |
| confusion_matrix() | Creates a confusion matrix to evaluate classification performance. |
| classification_report() | Provides precision, recall, and F1-score for classification models. |
Key Takeaways:
Matplotlib:
- Essential for visualizing data, identifying trends, and communicating insights.
- Provides diverse plot types and customization options.
Scikit-learn:
- The backbone of machine learning in Python.
- Simplifies the implementation of algorithms and supports complete ML workflows.
Next Topic : Mastering Python Libraries with pip

.png)




.png)
.png)
