Introduction
Data analysis is the backbone of machine learning and data-driven decision-making. For beginners, working with small datasets is an excellent way to understand how to clean, manipulate, and extract insights from data. In this blog, we'll analyze a small dataset, such as the Titanic dataset or a simple sales dataset, using Python. This will help you strengthen your foundational skills in data analysis.
What You’ll Learn
- Loading datasets and exploring their structure.
- Cleaning and preparing data for analysis.
- Extracting meaningful insights through data analysis.
- Practical Python techniques for real-world data.
Step 1: Setting Up the Environment
Prerequisites
Ensure you have Python and the following libraries installed:
- Pandas: For data manipulation.
- NumPy: For numerical computations.
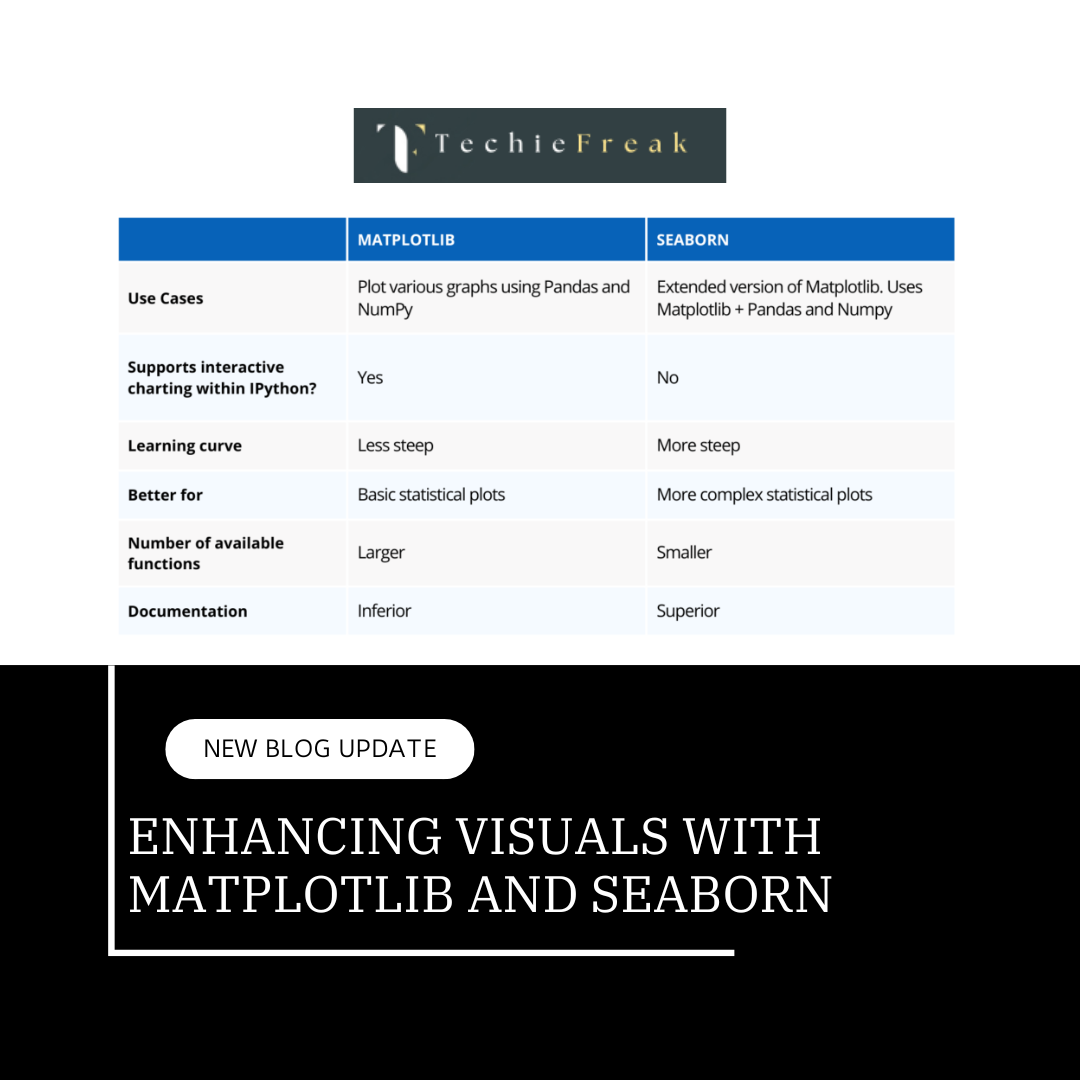
- Matplotlib: For basic plotting.
- Seaborn: For advanced visualizations.
To install them, run:
pip install pandas numpy matplotlib seaborn
Dataset
We'll use the Titanic dataset, a classic small dataset available on Kaggle. Alternatively, you can use a simple sales dataset (e.g., CSV with columns like Date, Region, and Sales).
Step 2: Loading and Exploring the Data
Loading the Dataset
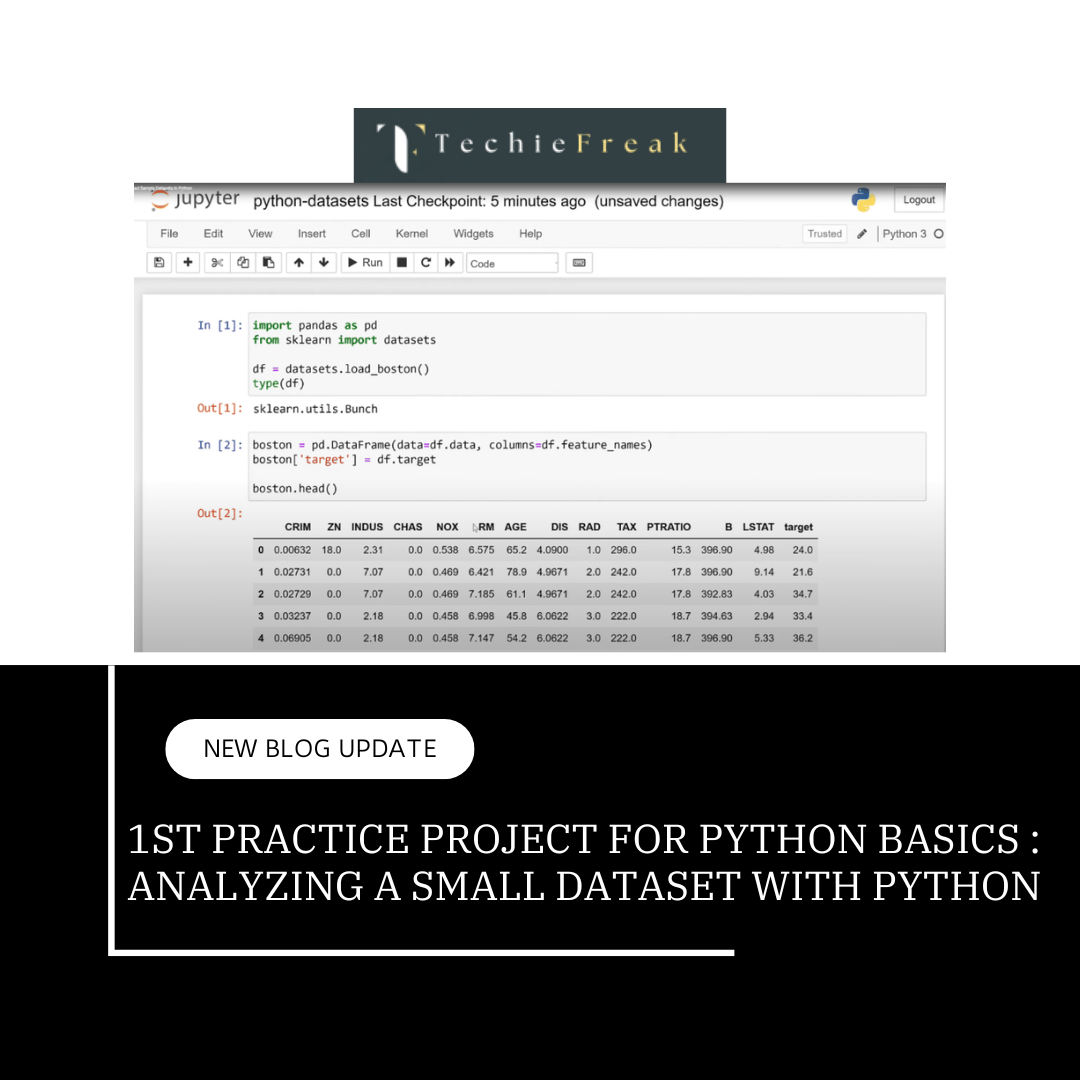
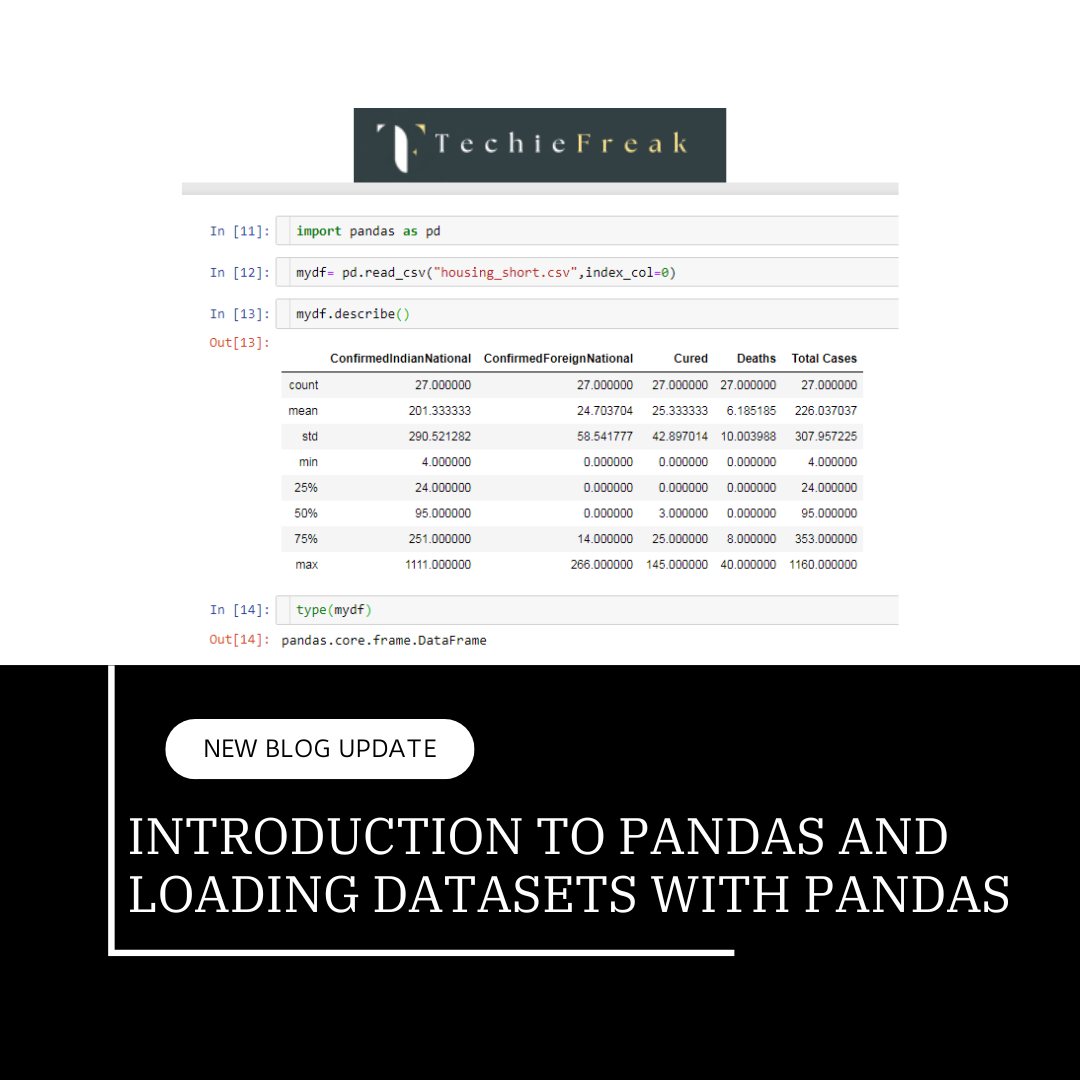
Using Pandas, load the dataset into a DataFrame:
import pandas as pd

# Load Titanic dataset
data = pd.read_csv('titanic.csv')  # Replace with 'sales_data.csv' if using sales data
print(data.head())  # View first five rows
Basic Exploration
Perform initial exploration to understand the data structure:
- Shape of the data:
print(f"Dataset contains {data.shape[0]} rows and {data.shape[1]} columns.")
- Column data types and null values:
print(data.info()) # Provides column types and null counts
- Statistical Summary:
print(data.describe()) # Summary of numerical columns
Step 3: Cleaning the Data
Handling Missing Values
Missing data can affect analysis. Identify and handle them appropriately:
- Identify missing values:
print(data.isnull().sum())
- Drop columns with too many nulls:
data.drop(columns=['Cabin'], inplace=True) # Example: Dropping Cabin column
- Fill missing values:
data['Age'].fillna(data['Age'].mean(), inplace=True)  # Filling Age with mean
data['Embarked'].fillna(data['Embarked'].mode()[0], inplace=True)  # Filling categorical column
Encoding Categorical Variables
Convert non-numerical columns into numerical formats:
data = pd.get_dummies(data, columns=['Sex', 'Embarked'], drop_first=True)
Step 4: Analyzing the Data
Understanding Key Metrics
- Survival rate across passenger classes:
survival_by_class = data.groupby('Pclass')['Survived'].mean()
print("Survival rates by passenger class:")
print(survival_by_class)
- Survival rate based on gender:
survival_by_gender = data.groupby('Sex_male')['Survived'].mean()
print("Survival rates by gender:")
print(survival_by_gender)
- Age distribution of survivors:
survivor_age = data[data['Survived'] == 1]['Age']
print("Average age of survivors:", survivor_age.mean())
- Correlation analysis:
Understand relationships between variables:
correlation_matrix = data.corr()
print(correlation_matrix)
Step 5: Advanced Analysis
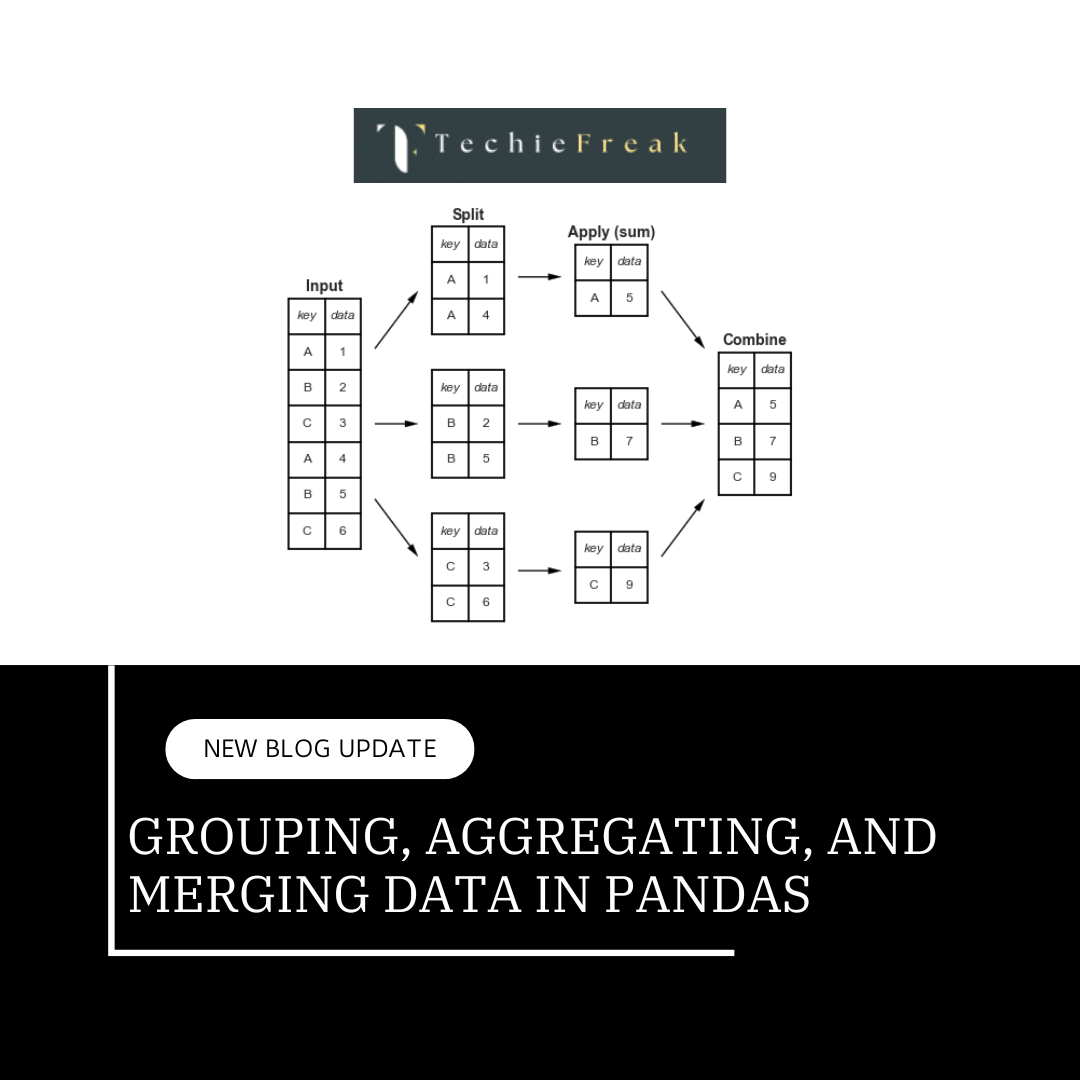
Aggregating Data
Analyze survival rate based on multiple factors, e.g., gender and class:
multi_group = data.groupby(['Sex_male', 'Pclass'])['Survived'].mean()
print(multi_group)
Custom Metrics
Create custom metrics, such as survival probability adjusted for fare:
data['Fare_per_person'] = data['Fare'] / (data['Parch'] + data['SibSp'] + 1)
print(data[['Fare', 'Fare_per_person']].head())
Key Insights from the Titanic Dataset
- Gender Impact: Females had a much higher survival rate than males.
- Class Impact: Passengers in higher classes (1st and 2nd) had significantly better survival rates.
- Age Factor: Younger passengers had slightly better survival chances.
Step 6: Conclusion and Takeaways
Conclusion
Analyzing datasets is a fundamental skill in machine learning and data science. This blog demonstrated how to:
- Load and explore data using Pandas.
- Clean data effectively by handling missing values and encoding.
- Analyze data to uncover insights using Python.
Takeaways
- Exploration is Key: Always start with a thorough understanding of your dataset.
- Clean Data for Accuracy: Missing values and categorical data must be addressed carefully.
- Insights Drive Action: Understanding the data’s story is crucial for making informed decisions.
Next Steps
- Try analyzing other datasets, such as sales or weather data.
- Explore advanced topics like feature engineering and model building.
- Combine analysis with visualizations (as we'll cover in the next blog).
By practicing these skills, you’ll lay a strong foundation for your journey in machine learning and data analysis.
Next Topic : 2nd Practice projects for Python basics
.png)






.png)
.png)
