.png)
What is Mean-Shift Clustering?
Mean-Shift Clustering is a non-parametric, centroid-based clustering algorithm commonly used in machine learning and data analysis. Unlike other clustering algorithms, such as k-means, it does not require predefining the number of clusters. Instead, it identifies the number of clusters dynamically by finding dense regions in the feature space. The algorithm is particularly useful for applications where the number of clusters is unknown or varies.
At its core, Mean-Shift works by iteratively shifting data points toward the mode (i.e., the peak) of the data distribution, eventually grouping points around these modes into clusters.
Why Use Mean-Shift Clustering?
Mean-shift clustering offers unique advantages over traditional clustering methods, making it suitable for various applications. Here's why you might choose to use it:
1. No Need to Predefine the Number of Clusters
- Unlike K-Means, Mean-Shift does not require specifying the number of clusters beforehand.
- The algorithm automatically determines the number of clusters based on the data density.
2. Handles Arbitrary Cluster Shapes
- Mean-Shift can identify clusters of arbitrary shapes and sizes, unlike algorithms like K-Means that assume clusters are spherical.
- It works well with datasets that have complex or non-linear cluster boundaries.
3. Adaptive to Varying Data Densities
- With adaptive bandwidth, the algorithm can effectively handle regions of varying densities in the dataset.
- This flexibility allows it to perform better than other clustering methods in heterogeneous datasets.
4. Density-Based Clustering
- By identifying regions of high density (local maxima of the density function), Mean-Shift creates clusters that are more intuitive and meaningful, especially for data with natural density variations.
5. Robust to Outliers
- Mean-Shift is less sensitive to outliers compared to algorithms like K-Means, as outliers do not affect the density peaks significantly.
- Data points that do not belong to any dense region are left unclustered.
6. Versatile Applications
- Mean-Shift is widely used in various fields, such as:
- Computer Vision: Image segmentation, object tracking.
- Data Analysis: Clustering in high-dimensional datasets.
- Geospatial Analysis: Grouping locations or hotspots.
- Image Processing: Edge detection and feature extraction.
7. Works with High-Dimensional Data
- Unlike distance-based algorithms like K-Means, Mean-Shift can handle high-dimensional data effectively using kernel density estimation (KDE).
8. Intuitive Results
- The resulting clusters are based on natural groupings in the data, providing more interpretable outcomes.
How Does Mean-Shift Clustering Work?
Mean-shift clustering works by iteratively updating the location of centroids based on the density of data points. Below is a step-by-step breakdown of the process:
Kernel Density Estimation (KDE)
To find regions of high data density, the algorithm employs Kernel Density Estimation (KDE):
- KDE estimates the probability density function (PDF) of the data.
It smooths the contributions of each data point using a kernel function, typically Gaussian:
Formula:
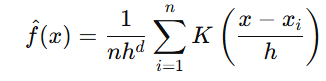
- h: Bandwidth parameter, controlling the size of the neighborhood.
- K: Kernel function, typically Gaussian, which gives higher weight to points closer to xxx.
Choosing the Right Bandwidth
The bandwidth parameter (h) is critical for determining clustering results.
Scott’s Rule:
Scott’s Rule is a method used to determine the optimal bin width for histograms in density estimation. It balances bias and variance to provide a smooth representation of the data distribution. A heuristic method to balance bias and variance.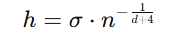
- σ: Standard deviation of the data.
- n: Number of data points.
- d: Dimensions of the dataset.
- Silverman’s Rule:
Silverman’s Rule is a method for selecting the optimal bandwidth (h) in Kernel Density Estimation (KDE). It aims to minimize the mean integrated squared error (MISE), providing a smooth and accurate density estimate.
An unimodal distribution is a probability distribution with a single peak or mode. This means it has only one most frequent value around which data is concentrated Similar to Scott’s rule but suited for unimodal distributions:
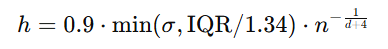
IQR: Interquartile range.
Where:
- h = bandwidth (smoothing parameter),
- σ = standard deviation of the dataset,
- n = number of data points.
3. Cross-Validation: - Split data into training and validation sets.
- Test different bandwidth values.
- Select the bandwidth-minimizing error on the validation set.
4. Expert Knowledge:
Domain-specific insights can guide bandwidth selection, particularly in fields like image processing.
5. Adaptive Bandwidth: - Applies varying bandwidths across regions of the dataset.
- Adjusts the bandwidth locally based on data density.
Mean Shift Vector
The Mean Shift Vector is a displacement vector that points toward the region of the highest data density in a given neighborhood. It is calculated as the difference between the mean of the data points within a specified bandwidth and the current data point. The mean shift vector is the core of the algorithm:
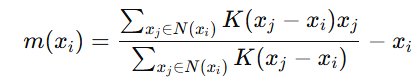
- N(xi): Neighborhood around xi, defined by the bandwidth.
- The vector m(xi) indicates the direction and magnitude to move xi towards the densest region.
The Mean Shift Vector is used in various applications where detecting high-density regions or clustering data points is required. Some key use cases include:
1. Computer Vision & Image Processing
- Object Tracking: The Mean Shift algorithm helps track objects by shifting the search window to the densest region of pixels matching the object's appearance.
- Image Segmentation: It is used to group similar pixels in an image, aiding in tasks like edge detection and object recognition.
2. Clustering & Pattern Recognition
- Mode-seeking Clustering: Unlike k-means, Mean Shift does not require the number of clusters to be predefined, making it useful for discovering natural cluster structures.
- Density Estimation: Helps identify areas of high probability density in datasets.
3. Anomaly Detection
- Used in outlier detection by identifying sparse regions in data distributions.
4. Feature Space Analysis
- Helps in discovering patterns in feature distributions, such as grouping similar data points in high-dimensional spaces.
5. Image Denoising & Smoothing
- Used in image filtering techniques to reduce noise while preserving important details.
Algorithm Steps
- Initialization:
Begin with all data points as potential cluster centers. Calculate Mean Shift:
For each data point xi:
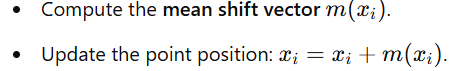
- Iterate Until Convergence:
Repeat the process until the cluster centers stabilize (i.e., shifts are smaller than a predefined threshold).
Convergence
- The algorithm converges when all points are tightly grouped around the local maxima of the density function.
- These local maxima act as cluster centers.
- Points attracted to the same mode are assigned to the same cluster.
Advantages of Mean-Shift Clustering
- Dynamic Clustering: Automatically determines the number of clusters.
- Flexibility: Handles non-linear cluster boundaries.
- Versatility: Works with data in arbitrary feature spaces.
Limitations of Mean-Shift Clustering
- Computational Complexity: Mean-Shift can be computationally intensive for large datasets due to its iterative nature.
- Bandwidth Selection: Choosing an appropriate bandwidth is crucial and often requires trial and error.
- Sensitivity to Density Peaks: Performance depends on the density of data points; sparse datasets may lead to poor clustering results.
Applications of Mean-Shift Clustering
- Image Segmentation: Identifying homogeneous regions in an image.
- Object Tracking: Locating objects in video sequences.
- Anomaly Detection: Detecting outliers in data.
- Spatial Analysis: Grouping geospatial data points based on density.
When to Use Mean-Shift
- When you don't know the number of clusters in advance.
- For datasets with complex, non-linear cluster shapes.
- When your data has varying densities or requires density-based clustering.
- In scenarios where interpretability and robustness to outliers are important.
Key Takeaways: Mean-Shift Clustering
- Non-Parametric Clustering: This does not require specifying the number of clusters beforehand.
- Density-Based: Identifies clusters by finding high-density regions in feature space.
- Flexible Cluster Shapes: Works well with arbitrary and non-linear cluster boundaries.
- Bandwidth Selection is Crucial: Choosing the right bandwidth affects clustering accuracy.
- Computationally Intensive: More expensive than K-Means, especially for large datasets.
- Robust to Outliers: Less sensitive to outliers compared to K-Means.
- Used in Various Applications: Image segmentation, object tracking, anomaly detection, and geospatial analysis.
- Adaptive to Data Density: Can handle datasets with varying densities.
- Converges to Density Peaks: Each data point shifts toward the nearest high-density region.
- Useful When Cluster Count is Unknown: Ideal when the number of clusters is not predefined.
Next Blog- Python implementation of mean shift clustering

.png)
.png)
.png)
.png)
.png)
.png)
.png)
.png)
.png)
.png)
.png)
.png)
.png)
.png)
.png)
.png)
.png)
.png)
.png)
.png)
.png)
.png)
.png)