.png)
Introduction to K-Means Clustering
K-Means Clustering is an Unsupervised Learning algorithm, which groups the unlabeled dataset into different clusters. Here K defines the number of pre-defined clusters that need to be created in the process, as if K=2, there will be two clusters, and for K=3, there will be three clusters, and so on.
It is an iterative algorithm that divides the unlabeled dataset into k different clusters in such a way that each dataset belongs only one group that has similar properties.
It allows us to cluster the data into different groups and a convenient way to discover the categories of groups in the unlabeled dataset on its own without the need for any training.
It is a centroid-based algorithm, where each cluster is associated with a centroid. The main aim of this algorithm is to minimize the sum of distances between the data point and their corresponding clusters.
The algorithm takes the unlabeled dataset as input, divides the dataset into k-number of clusters, and repeats the process until it does not find the best clusters. The value of k should be predetermined in this algorithm.
The k-means clustering algorithm mainly performs two tasks:
- Determines the best value for K center points or centroids by an iterative process.
- Assigns each data point to its closest k-center. Those data points which are near to the particular k-center, create a cluster.
Hence each cluster has datapoints with some commonalities, and it is away from other clusters.
Key Features of K-Means:
- Unsupervised Learning: K-Means is an unsupervised learning algorithm, meaning it does not require labeled data. It tries to discover inherent patterns in the data.
- Efficiency: The algorithm is computationally efficient and scales well to large datasets.
- Convergence: K-Means generally converges to a local optimum after a number of iterations, but the quality of the solution can depend on the initial placement of centroids.
- Limitations:
- K Selection: The choice of K, the number of clusters, is a significant factor. If the wrong value of K is chosen, the clustering results can be poor.
- Sensitivity to Initialization: The algorithm can converge to different results based on the initial choice of centroids. Different initializations may lead to different cluster assignments.
- Assumption of Spherical Clusters: K-Means works well when clusters are spherical and equally sized. It may not perform well if the data has clusters with varying shapes or densities.
How K-Means Clustering Works
K-Means clustering is a widely used unsupervised machine learning algorithm for partitioning data into kk distinct clusters. It works by iteratively grouping similar data points together based on their features. Here’s a step-by-step explanation of how K-Means clustering works:
1. Define the Number of Clusters (kk)
- Input: Decide how many clusters (kk) you want to form.
- This is typically determined based on domain knowledge or through methods like the Elbow Method or Silhouette Score.
2. Initialize Cluster Centroids
- Randomly select kk points from the dataset as the initial centroids.
- These centroids are the "mean points" around which the clusters will form.
3. Assign Data Points to the Nearest Centroid
- For each data point in the dataset:
- Compute the distance (e.g., Euclidean distance) to each centroid.
- Assign the data point to the cluster of the nearest centroid.
4. Recalculate Centroids
- For each cluster, calculate the mean of all data points assigned to that cluster.
- Update the centroid position to this new mean.
5. Repeat Steps 3 and 4
- Continue assigning data points to the nearest centroid and recalculating the centroids.
- This iterative process continues until one of the following conditions is met:
- Centroids stabilize (i.e., no significant movement in their positions).
- Maximum iterations are reached.
6. Output the Final Clusters
- Once the algorithm converges, the clusters are formed, and each data point belongs to one of the kk clusters.
Visual Explanation
- Imagine points scattered in a 2D space.
- Initially, centroids are randomly placed.
- Data points gravitate toward the closest centroid, forming provisional clusters.
- Centroids shift as the clusters evolve, and the process repeats until a stable configuration emerges.
Mathematics Behind K-Means
Distance Calculation:
The distance between a point xix_i and a centroid μj\mu_j is typically calculated using the Euclidean distance formula: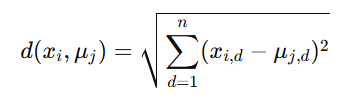
Objective Function:
K-Means minimizes the intra-cluster variance, defined as: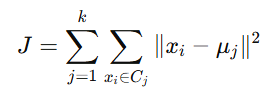
Where CjC_j represents the set of points in cluster jj.
Choosing the Optimal Number of Clusters (K)
Selecting the right number of clusters is crucial. Common methods include:
Choosing the optimal number of clusters (kk) is a critical step in K-Means clustering, as it directly impacts the algorithm's performance and the interpretability of the results. There are several techniques to determine the best kk. Below are the most commonly used methods:
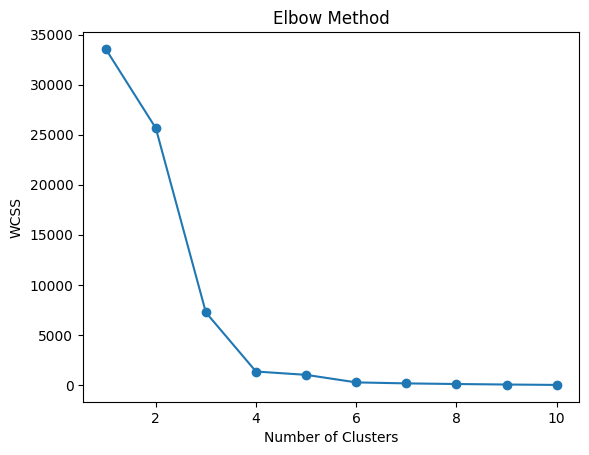
1. The Elbow Method
The Elbow Method involves plotting the within-cluster sum of squared distances (often called inertia or within-cluster variance) against a range of possible K values, and then looking for an "elbow" point in the graph. This elbow represents the optimal number of clusters.
Steps:
- Run K-Means for a range of k values (e.g., 1 to 10).
- For each k, calculate the WCSS.
- Plot k vs. WCSS.
- Look for the "elbow point," where the WCSS curve starts to flatten. This indicates diminishing returns as kk increases.
How to Interpret the Elbow Method?
- Before the Elbow: As the number of clusters increases, the inertia decreases rapidly. This is expected because adding more clusters will naturally reduce the distance between points and centroids.
- After the Elbow: Beyond the elbow point, the inertia decreases at a much slower rate. This indicates that the additional clusters do not provide significant improvements, and the model begins to overfit.
The elbow point suggests the optimal number of clusters, where the addition of more clusters would not yield substantial gains in data representation.
Limitations of the Elbow Method
- Subjectivity: The exact location of the elbow can sometimes be unclear, especially when the plot doesn’t show a sharp change in the rate of decrease.
- Complex Data: In some complex datasets, there may not be a clear elbow, or the elbow may be subtle. In such cases, other methods, such as the Silhouette Score or Gap Statistic, can help.
- Large Datasets: The method can be computationally expensive for large datasets since you need to run K-Means multiple times for each K value.
Understanding Distortion and Inertia in K-Means Clustering
K-Means clustering is an unsupervised machine learning algorithm used to group similar data points into clusters. The effectiveness of the clustering model is evaluated by metrics such as Distortion and Inertia, which help measure the compactness and quality of the clusters. These metrics guide us in determining how well the algorithm has grouped the data points, and they are essential in methods like the Elbow Method for finding the optimal number of clusters.
Let’s dive deeper into each of these concepts:
A. Distortion
Distortion is a metric used to assess how well a set of data points fits into the clusters formed by K-Means. It calculates the average squared distance between each data point and its assigned cluster centroid.
Mathematically, the distortion for a given set of clusters is computed as:
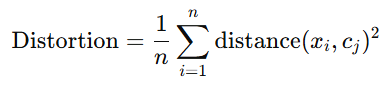
Where:
- xi is the i-th data point.
- cj is the centroid of the cluster to which xi belongs.
- The distance is typically measured using the Euclidean distance, which is the straight-line distance between the data point and the cluster centroid.
The goal of K-Means clustering is to minimize distortion. This means that the algorithm aims to place the cluster centroids in such a way that the data points in each cluster are as close as possible to their respective centroids. Lower distortion indicates better clustering, as it signifies that the points are more tightly grouped around their centroids.
B. Inertia
Inertia is another important metric that is closely related to distortion. In fact, inertia is the sum of squared distances from each data point to the nearest cluster centroid. It essentially represents the total error or "spread" of the data points in the clusters.
Mathematically, inertia is computed as:
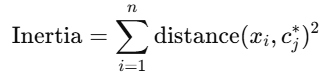
Where:
- xi is the i-th data point.
- cj is the closest cluster centroid to the point xi.
- The distance is typically the Euclidean distance between the data point and its closest cluster centroid.
Inertia represents the total squared error of the clustering process. A lower inertia value indicates that the data points are closer to their respective centroids, suggesting better clustering quality. Just like distortion, minimizing inertia is key to achieving high-quality clusters.
Relationship Between Distortion and Inertia
While both distortion and inertia measure how well the data points fit into the clusters, there is a key distinction:
- Inertia refers to the total sum of squared distances between all data points and their closest centroids. It is a measure of the overall error in the clustering.
- Distortion is the average squared distance between data points and their assigned centroids, which is essentially the mean inertia per data point.
In essence, inertia is the numerator of the distortion formula, and distortion is simply the average inertia per data point.
How These Metrics Are Used in the Elbow Method
The Elbow Method is a technique used to determine the optimal number of clusters in K-Means. The idea is to run K-Means for different values of K (number of clusters), calculate the distortion or inertia for each K, and then plot these values.
Here’s how the Elbow Method works with distortion or inertia:
- Run K-Means for Different K Values: Perform clustering with various values of K (e.g., 1 to 10 clusters).
- Calculate Distortion or Inertia: For each K, compute the corresponding distortion or inertia.
- Plot Distortion or Inertia vs. K: Plot the calculated values of distortion or inertia against the number of clusters K.
- Identify the "Elbow": The plot will show a rapid decrease in distortion/inertia as the number of clusters increases. However, beyond a certain point, the rate of decrease slows down significantly. The "elbow" of the graph represents the point where adding more clusters no longer provides a substantial improvement in clustering.
This elbow point is the optimal number of clusters, as it reflects the point at which adding more clusters doesn’t significantly reduce the total error (distortion or inertia).
Example
Imagine you run K-Means clustering on a dataset with K values from 1 to 10. You plot the inertia values for each K, and the graph might look something like this:
| K (Clusters) | Inertia |
|---|---|
| 1 | 5000 |
| 2 | 4000 |
| 3 | 3500 |
| 4 | 3300 |
| 5 | 3200 |
| 6 | 3100 |
| 7 | 3050 |
| 8 | 3020 |
| 9 | 3010 |
| 10 | 3005 |
As you can see, the inertia drops significantly from K = 1 to K = 4, but after that, the rate of decrease slows down. The elbow occurs at K = 4, suggesting that the optimal number of clusters is 4.
2. The Silhouette Method
The Silhouette Method measures how similar a point is to its own cluster compared to other clusters. It provides a score between −1-1 and 11:
- 1: Perfect clustering.
- 0: Overlapping clusters.
- -1: Misclassified clusters.
Steps:
- Compute the Silhouette Score for different kk values.
- The optimal kk has the highest average Silhouette Score.
3. Gap Statistic Method
The Gap Statistic compares the WCSS of your data with the WCSS of a randomly distributed dataset. If the gap is large, the clustering structure is statistically significant.
Steps:
- Generate a reference dataset with a random distribution.
- Compute WCSS for the actual and random datasets for each kk.
- The optimal kk maximizes the gap.
4. Davies-Bouldin Index
The Davies-Bouldin Index measures the average similarity ratio of each cluster with the one it is most similar to. Lower values indicate better clustering.
Steps:
- Compute the Davies-Bouldin Index for different kk.
- The optimal kk minimizes the index.
5. Domain Knowledge
Sometimes, the optimal kk is determined by the context of the problem or expert knowledge. For example:
- If segmenting customers, kk might be based on predefined customer personas.
- If clustering geographic regions, kk might depend on administrative boundaries.
Choosing the Right Method
- Elbow Method is the most common and easiest to understand.
- Silhouette Method is helpful for validating the quality of clustering.
- Gap Statistic is robust but computationally intensive.
- Use domain knowledge when the problem context provides clues about the number of clusters.
Applications of K-Means Clustering
- Market Segmentation: Grouping customers based on purchasing behavior.
- Image Compression: Reducing the number of colors in an image by clustering pixels.
- Anomaly Detection: Identifying unusual patterns in network traffic or financial data.
- Document Clustering: Grouping similar documents or articles for topic modeling.
Advantages of K-Means Clustering
- Simple and easy to implement.
- Scales well to large datasets.
- Works efficiently when the clusters are well-separated and spherical.
Limitations of K-Means Clustering
- Sensitive to the initial choice of centroids.
- May not perform well with non-spherical clusters.
- Requires the number of clusters KK to be specified in advance.
- Struggles with imbalanced cluster sizes.
Key Takeaways from K-Means Clustering:
- Unsupervised Learning: K-Means is an unsupervised algorithm that groups unlabeled data into clusters based on similarities.
- Centroid-Based: Each cluster is represented by a centroid, and the algorithm minimizes the distance between data points and their assigned centroids.
- Iterative Process: The algorithm assigns data points to the nearest centroid, recalculates centroids, and repeats until convergence.
- Choosing K: The number of clusters (K) must be predetermined. Methods like the Elbow Method help in selecting the optimal K.
- Distance Metrics: Typically, Euclidean distance is used to measure the distance between data points and centroids.
- Metrics for Quality: Distortion (average squared distance) and Inertia (total squared distance) help evaluate the clustering quality.
- Limitations: K-Means can be sensitive to the initial placement of centroids and may not work well with non-spherical clusters or imbalanced data.
- Applications: Common applications include market segmentation, image compression, anomaly detection, and document clustering.
- Choosing K Methods: Other methods for determining K include Silhouette Method, Gap Statistic, and Davies-Bouldin Index.
- Advantages: K-Means is simple, efficient, and scales well to large datasets, but it requires a pre-defined K and is sensitive to initial conditions.
.png)
.png)
.png)
.png)
.png)
.png)
.png)
.png)
.png)
.png)
.png)
.png)
.png)
.png)
.png)
.png)
.png)
.png)
.png)
.png)
.png)
.png)
.png)