Grouping, Aggregating, and Merging Data in Pandas
Efficient data manipulation is a cornerstone of any data analysis workflow. In this blog, we’ll explore three essential operations in Pandas: grouping, aggregating, and merging. These techniques allow you to analyze, summarize, and combine data effectively, making Pandas a powerful tool for handling real-world datasets.
1. Grouping Data in Pandas
The groupby() function in Pandas is used to group data based on one or more columns. Grouping is particularly useful when you want to perform operations like calculating totals, averages, or counts for specific categories in your data.
How groupby() Works
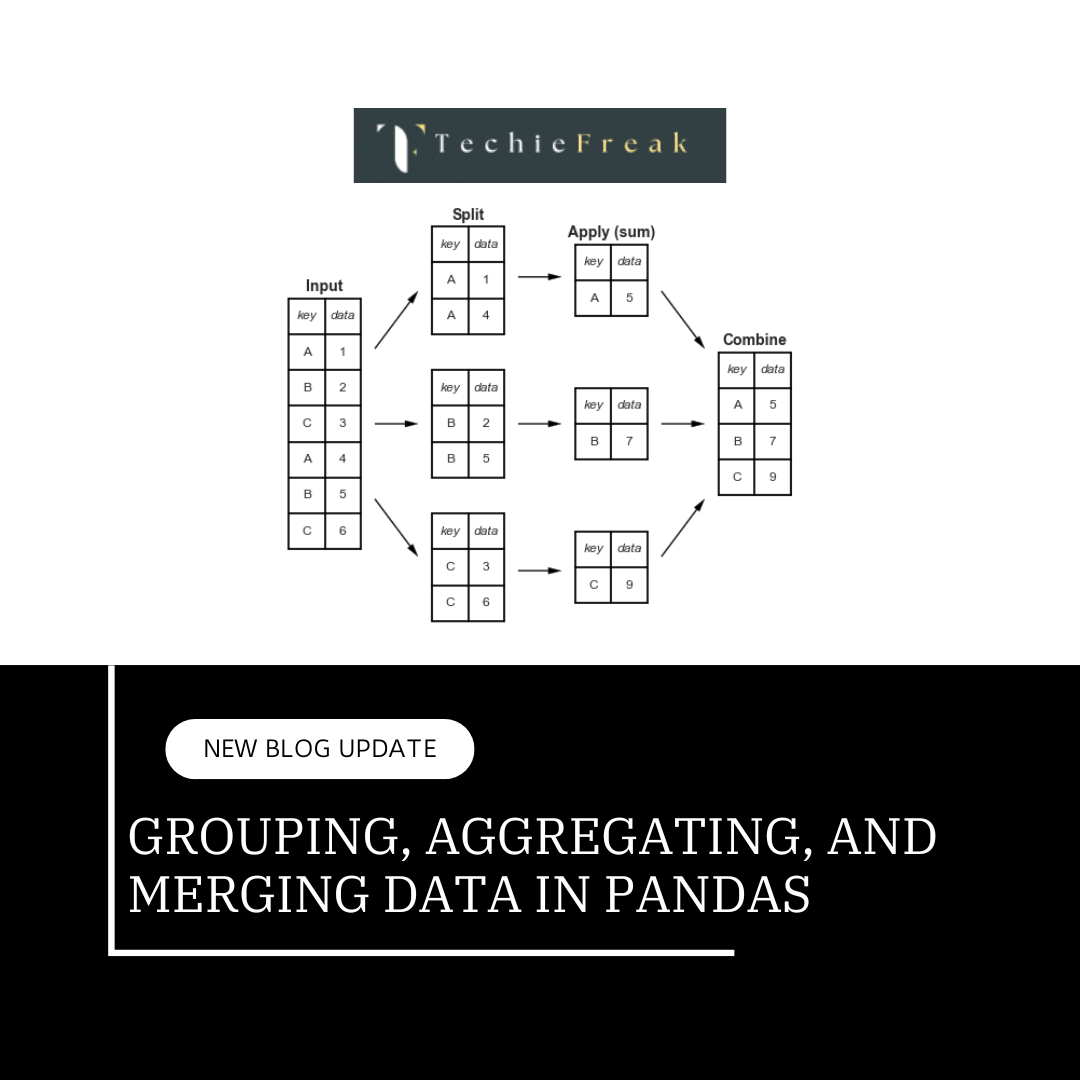
The groupby() operation involves three steps:
- Splitting: The data is split into groups based on the specified criteria.
- Applying: A function (e.g., sum, mean) is applied to each group.
- Combining: The results are combined into a new DataFrame or Series.
Example: Grouping Data
Let’s consider a dataset of sales transactions:
import pandas as pd

# Sample DataFrame
data = {
    'Region': ['North', 'South', 'North', 'East', 'South'],
    'Salesperson': ['Alice', 'Bob', 'Alice', 'Charlie', 'Bob'],
    'Sales': [200, 300, 150, 400, 250]
}

df = pd.DataFrame(data)
print(df)
Output:
  Region Salesperson  Sales
0  North       Alice    200
1  South         Bob    300
2  North       Alice    150
3   East     Charlie    400
4  South         Bob    250
Now, group the data by Region and calculate the total sales for each region:
# Grouping by 'Region' and calculating total sales
grouped = df.groupby('Region')['Sales'].sum()
print(grouped)
Output:
Region
East     400
North    350
South    550
Name: Sales, dtype: int64
Grouping by Multiple Columns
You can group data by more than one column:
# Grouping by 'Region' and 'Salesperson'
grouped = df.groupby(['Region', 'Salesperson'])['Sales'].sum()
print(grouped)
Output:
Region  Salesperson
East    Charlie         400
North   Alice           350
South   Bob             550
Name: Sales, dtype: int64
2. Aggregating Data
Aggregation refers to applying summary statistics to grouped data. Common aggregation functions include sum, mean, count, max, min, etc.
Using Built-in Aggregation Functions
Let’s calculate multiple aggregate statistics for grouped data:
# Aggregating with multiple functions
aggregated = df.groupby('Region')['Sales'].agg(['sum', 'mean', 'count'])
print(aggregated)
Output:
         sum   mean  count
Region
East     400  400.0      1
North    350  175.0      2
South    550  275.0      2
Custom Aggregations
You can apply custom aggregation functions using a Python function or lambda:
# Custom aggregation: Calculate range of sales
def range_func(series):
    return series.max() - series.min()

aggregated = df.groupby('Region')['Sales'].agg(['sum', range_func])
print(aggregated)
Output:
         sum  range_func
Region
East     400          0
North    350         50
South    550         50
3. Merging DataFrames
Merging is the process of combining two or more DataFrames. Pandas provides the merge() function for this purpose. It works similarly to SQL joins.
Types of Joins in Pandas
- Inner Join: Returns rows with matching values in both DataFrames.
- Outer Join: Returns all rows from both DataFrames, filling missing values with NaN.
- Left Join: Returns all rows from the left DataFrame and matching rows from the right DataFrame.
Right Join: Returns all rows from the right DataFrame and matching rows from the left DataFrame.
_1735033866.png)
Example: Merging DataFrames
Suppose we have two DataFrames:
# First DataFrame
df1 = pd.DataFrame({
    'ID': [1, 2, 3],
    'Name': ['Alice', 'Bob', 'Charlie']
})

# Second DataFrame
df2 = pd.DataFrame({
    'ID': [2, 3, 4],
    'Sales': [500, 700, 600]
})

print(df1)
print(df2)
Output:
df1:
   ID     Name
0   1    Alice
1   2      Bob
2   3  Charlie

df2:
   ID  Sales
0   2    500
1   3    700
2   4    600
Inner Join
Merge the two DataFrames based on the ID column:
merged = pd.merge(df1, df2, on='ID', how='inner')
print(merged)
Output:
   ID     Name  Sales
0   2      Bob    500
1   3  Charlie    700
Outer Join
Perform an outer join to include all rows from both DataFrames:
merged = pd.merge(df1, df2, on='ID', how='outer')
print(merged)
Output:
   ID     Name  Sales
0   1    Alice    NaN
1   2      Bob  500.0
2   3  Charlie  700.0
3   4      NaN  600.0
Left Join
Include all rows from the left DataFrame (df1):
merged = pd.merge(df1, df2, on='ID', how='left')
print(merged)
Output:
   ID     Name  Sales
0   1    Alice    NaN
1   2      Bob  500.0
2   3  Charlie  700.0
Right Join
Include all rows from the right DataFrame (df2):
merged = pd.merge(df1, df2, on='ID', how='right')
print(merged)
Output:
   ID     Name  Sales
0   2      Bob  500.0
1   3  Charlie  700.0
2   4      NaN  600.0
Practical Use Cases
- Grouping and Aggregating: Summarizing sales by region, calculating averages for specific categories, or counting occurrences.
- Merging DataFrames: Combining customer details with their purchase histories, joining financial datasets, or integrating external metadata.
Key Takeaways
- Grouping: Use groupby() to split data into categories and apply operations on each group.
- Aggregating: Apply summary functions like sum, mean, or custom operations to grouped data.
- Merging: Combine multiple DataFrames using different types of joins (inner, outer, left, right) for seamless data integration.
- Practical Relevance: These operations are widely used in data preprocessing, analysis, and feature engineering in data science projects.
By mastering grouping, aggregating, and merging in Pandas, you can unlock powerful data manipulation capabilities, making your data analysis workflows more efficient and insightful.
Next Topic : Intoduction to Matplotlib and create simple plots




.png)






.png)
.png)

