Regression Algorithms in Machine Learning:
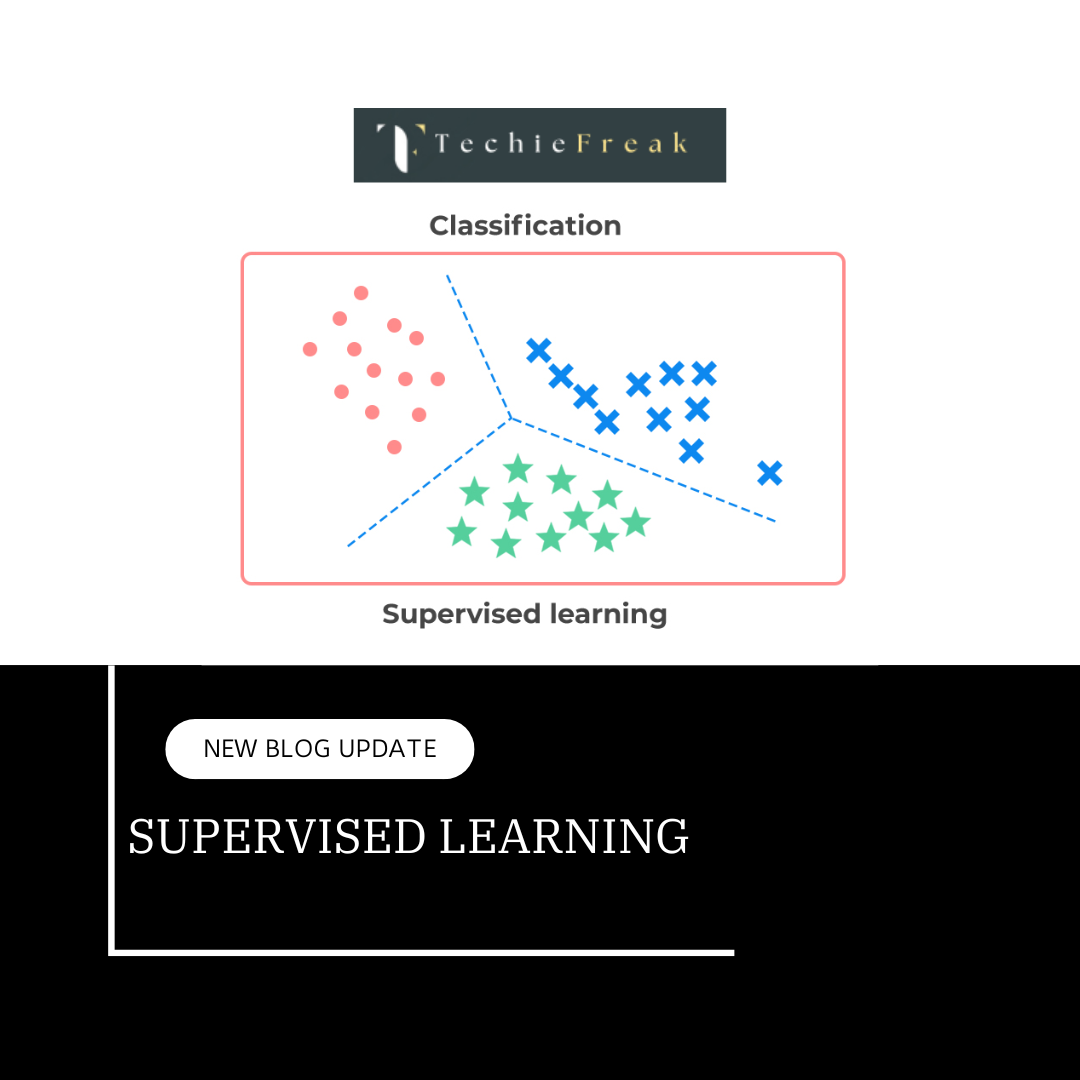
Regression is a supervised learning technique which helps in finding the correlation between variables and enables us to predict the continuous output variable based on the one or more predictor variables. It is mainly used for prediction, forecasting, time series modeling, and determining the causal-effect relationship between variables.
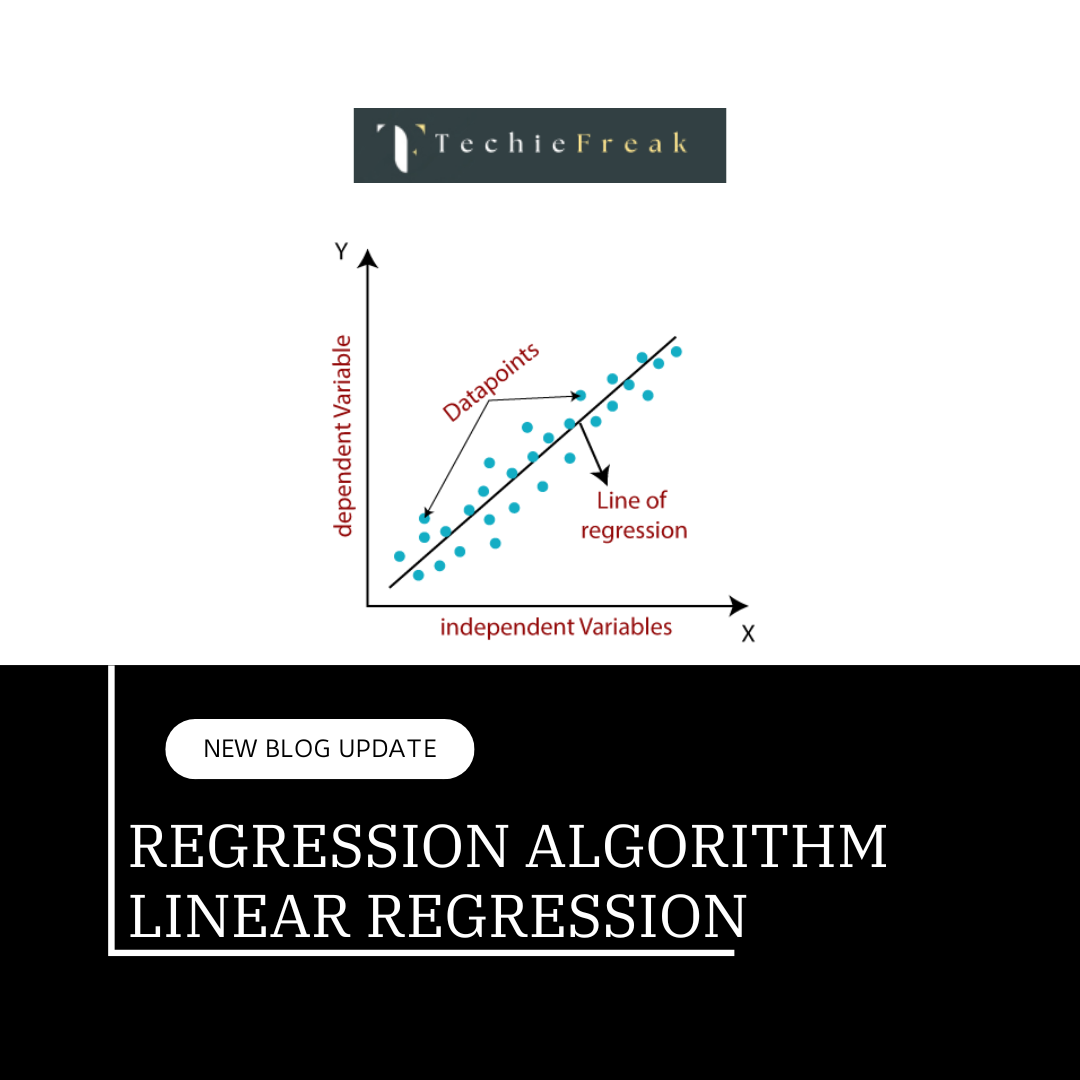
In Regression, we plot a graph between the variables which best fits the given datapoints, using this plot, the machine learning model can make predictions about the data. In simple words, "Regression shows a line or curve that passes through all the datapoints on target-predictor graph in such a way that the vertical distance between the datapoints and the regression line is minimum." The distance between datapoints and line tells whether a model has captured a strong relationship or not.
Some examples of regression can be as:
Prediction of rain using temperature and other factors
Determining Market trends
Prediction of road accidents due to rash driving.
Terminologies Related to the Regression Analysis:
Dependent Variable: The main factor in Regression analysis which we want to predict or understand is called the dependent variable. It is also called target variable.
Independent Variable: The factors which affect the dependent variables or which are used to predict the values of the dependent variables are called independent variable, also called as a predictor.
Outliers: Outlier is an observation which contains either very low value or very high value in comparison to other observed values. An outlier may hamper the result, so it should be avoided.
Multicollinearity: If the independent variables are highly correlated with each other than other variables, then such condition is called Multicollinearity. It should not be present in the dataset, because it creates problem while ranking the most affecting variable.
Underfitting and Overfitting: If our algorithm works well with the training dataset but not well with test dataset, then such problem is called Overfitting. And if our algorithm does not perform well even with training dataset, then such problem is called underfitting.
Why do we use Regression Analysis?
As mentioned above, Regression analysis helps in the prediction of a continuous variable. There are various scenarios in the real world where we need some future predictions such as weather condition, sales prediction, marketing trends, etc., for such case we need some technology which can make predictions more accurately. So for such case we need Regression analysis which is a statistical method and used in machine learning and data science. Below are some other reasons for using Regression analysis:
Regression estimates the relationship between the target and the independent variable.
It is used to find the trends in data.
It helps to predict real/continuous values.
By performing the regression, we can confidently determine the most important factor, the least important factor, and how each factor is affecting the other factors.
Types of Regression
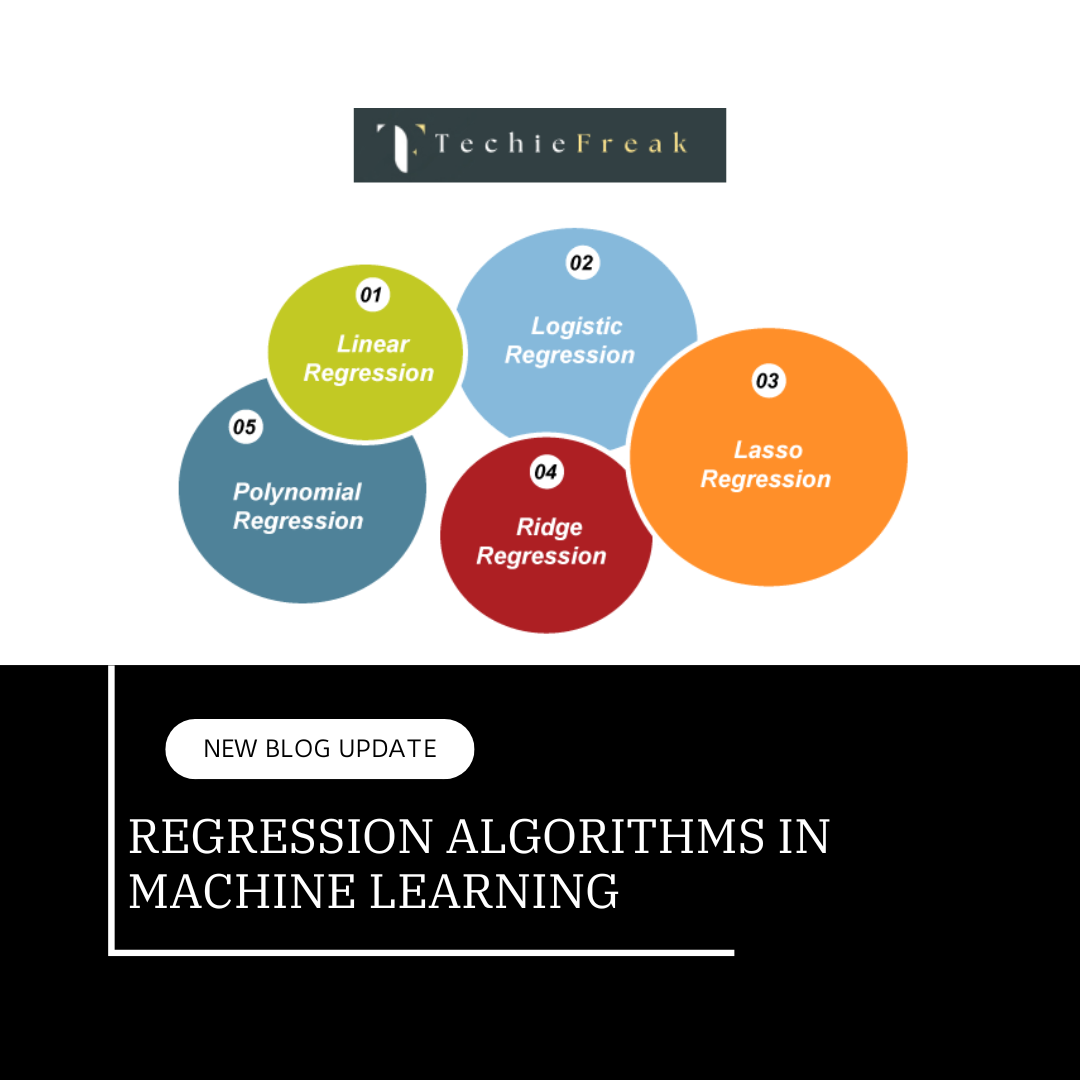
There are various types of regressions which are used in data science and machine learning. Each type has its own importance on different scenarios, but at the core, all the regression methods analyze the effect of the independent variable on dependent variables. Here we are discussing some important types of regression which are given below:
1. Linear Regression
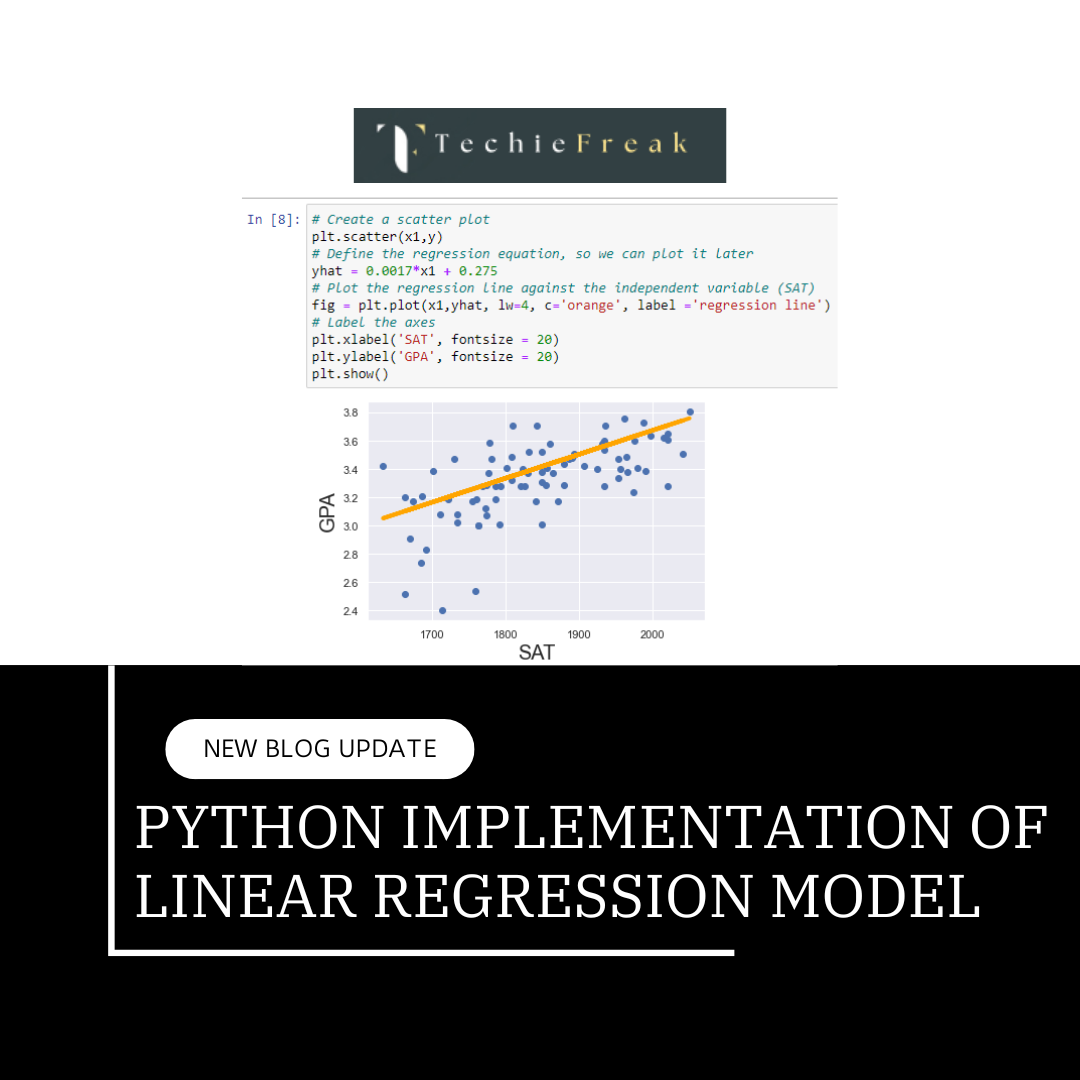
Linear regression is the most fundamental and widely used regression algorithm. It assumes a linear relationship between the independent variables (inputs) and the dependent variable (output). The goal is to find the best-fitting line that minimizes the difference between the predicted and actual values.
Formula:

Where:
- Y is the predicted output
- β0 is the intercept
- β1,β2,...βn are the coefficients
X1,X2,...Xn are the features (independent variables)
- When to Use: Linear regression is ideal when the relationship between the input variables and output is approximately linear.
- Strengths:
- Simple and interpretable
- Computationally efficient
- Works well for small datasets with a linear relationship
- Limitations:
- Sensitive to outliers
- Doesn’t perform well when there’s a non-linear relationship
2. Polynomial Regression
Polynomial regression is an extension of linear regression where the relationship between the independent and dependent variables is modeled as an nth-degree polynomial. This allows the model to capture non-linear relationships.
Formula:

Here, the input X is raised to different powers (degrees), allowing the model to fit more complex patterns.
- When to Use: Polynomial regression is useful when the data exhibits a curvilinear relationship, meaning the relationship between variables isn’t just a straight line.
- Strengths:
- Can model complex relationships
- More flexible than linear regression
- Limitations:
- Prone to overfitting, especially with higher degrees
- Computationally more expensive than linear regression
3. Ridge Regression
Ridge regression, also known as Tikhonov regularization, is an extension of linear regression that introduces a penalty term to the loss function. This penalty discourages large coefficients, thereby preventing overfitting and improving the model's generalization to unseen data.
Formula:

Where:
- λ is the regularization parameter
- βj are the coefficients of the model
- When to Use: Ridge regression is useful when there are many features in the dataset, and you want to prevent the model from overfitting.
- Strengths:
- Reduces model complexity
- Useful in situations where there are multicollinearities (correlations between independent variables)
- Limitations:
- Regularization doesn’t lead to sparse solutions (unlike Lasso, which can shrink coefficients to zero)
- Sensitive to the choice of the regularization parameter λ
4. Lasso Regression
Lasso regression (Least Absolute Shrinkage and Selection Operator) is another regularization technique, but unlike Ridge regression, Lasso can shrink some coefficients exactly to zero, effectively performing feature selection. It’s particularly useful when you suspect that many features are irrelevant or redundant.
Formula:

Where:
- λ is the regularization parameter
- ∣βj| represents the absolute value of the coefficients
- When to Use: Lasso is useful when you want both regularization and feature selection. It helps when working with high-dimensional datasets where you suspect that many variables are irrelevant.
- Strengths:
- Performs feature selection by shrinking some coefficients to zero
- Effective when dealing with sparse data
- Limitations:
- Can lead to underfitting if λ is set too high
- Sensitive to the choice of the regularization parameter
Key Takeaways
Each of these regression algorithms has its strengths and weaknesses, and the choice of which one to use depends on the nature of the dataset and the problem you’re trying to solve:
- Linear Regression: Simple, interpretable, and works well when there’s a linear relationship.
- Polynomial Regression: Flexible and can model curvilinear relationships but prone to overfitting.
- Ridge Regression: Prevents overfitting with a penalty term but doesn’t eliminate irrelevant features.
- Lasso Regression: Regularizes and performs feature selection by shrinking some coefficients to zero, making it ideal for sparse datasets.
By selecting the right algorithm, you can improve the accuracy and robustness of your regression model, enabling you to make better predictions and insights from your data.
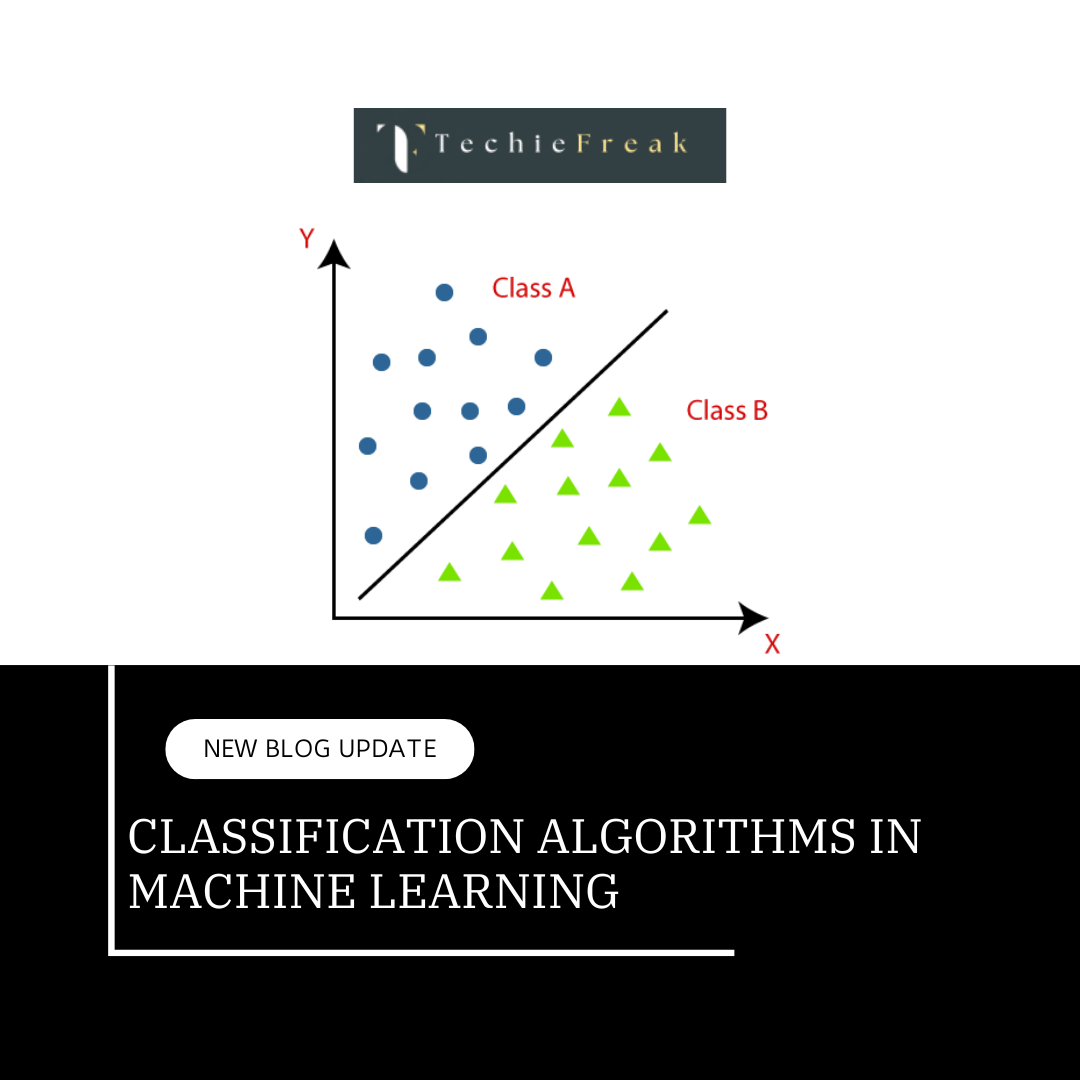
Next Topic- Classification Algorithms in Machine Learning
.png)
.png)
.png)
.png)
.png)
.png)
 Algorithm for Machine Learning.jpg)
 Algorithm.jpg)
.png)
.png)
.png)
.png)
.png)
.png)
