Classification Algorithms in Machine Learning: Logistic Regression, KNN, SVM, and Decision Trees
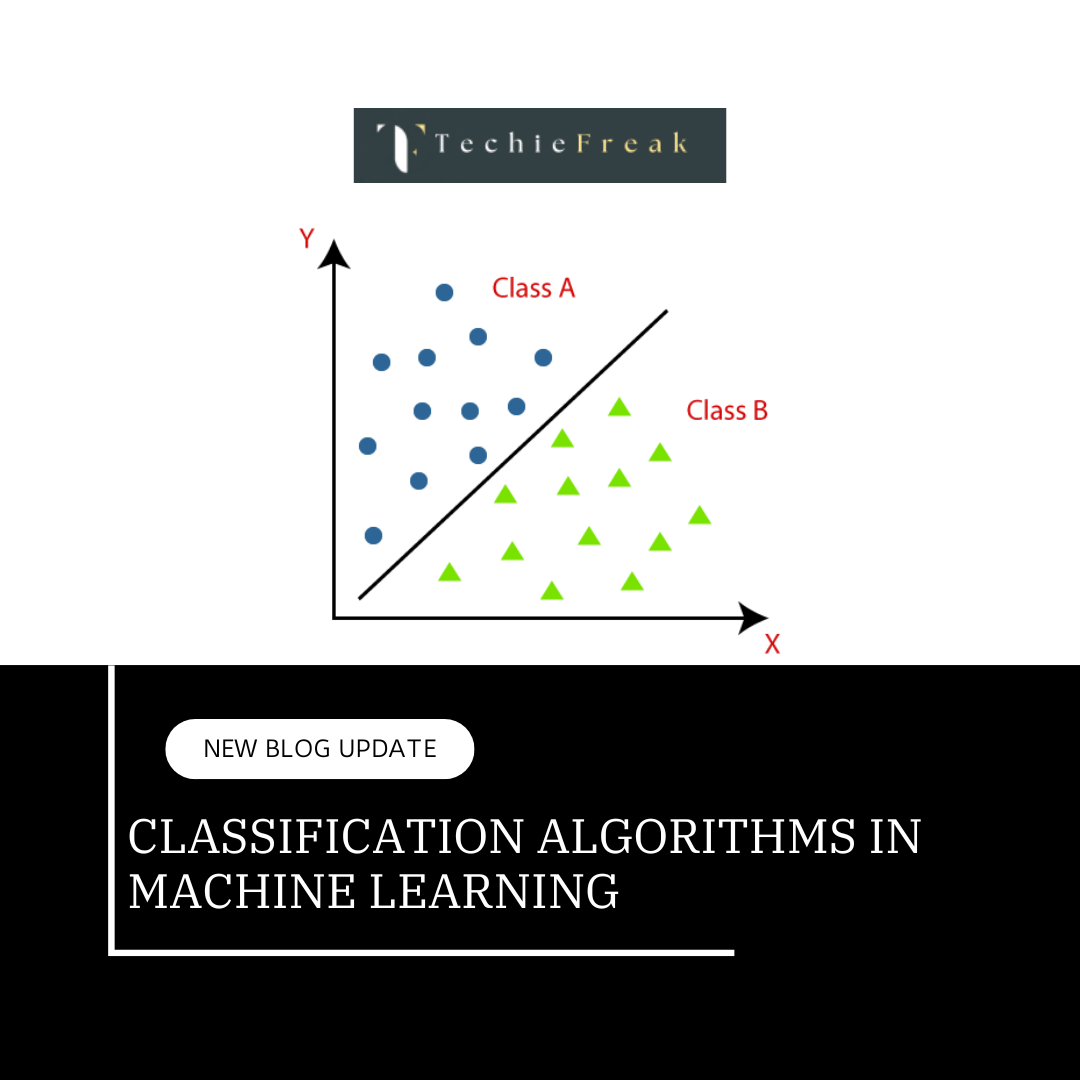
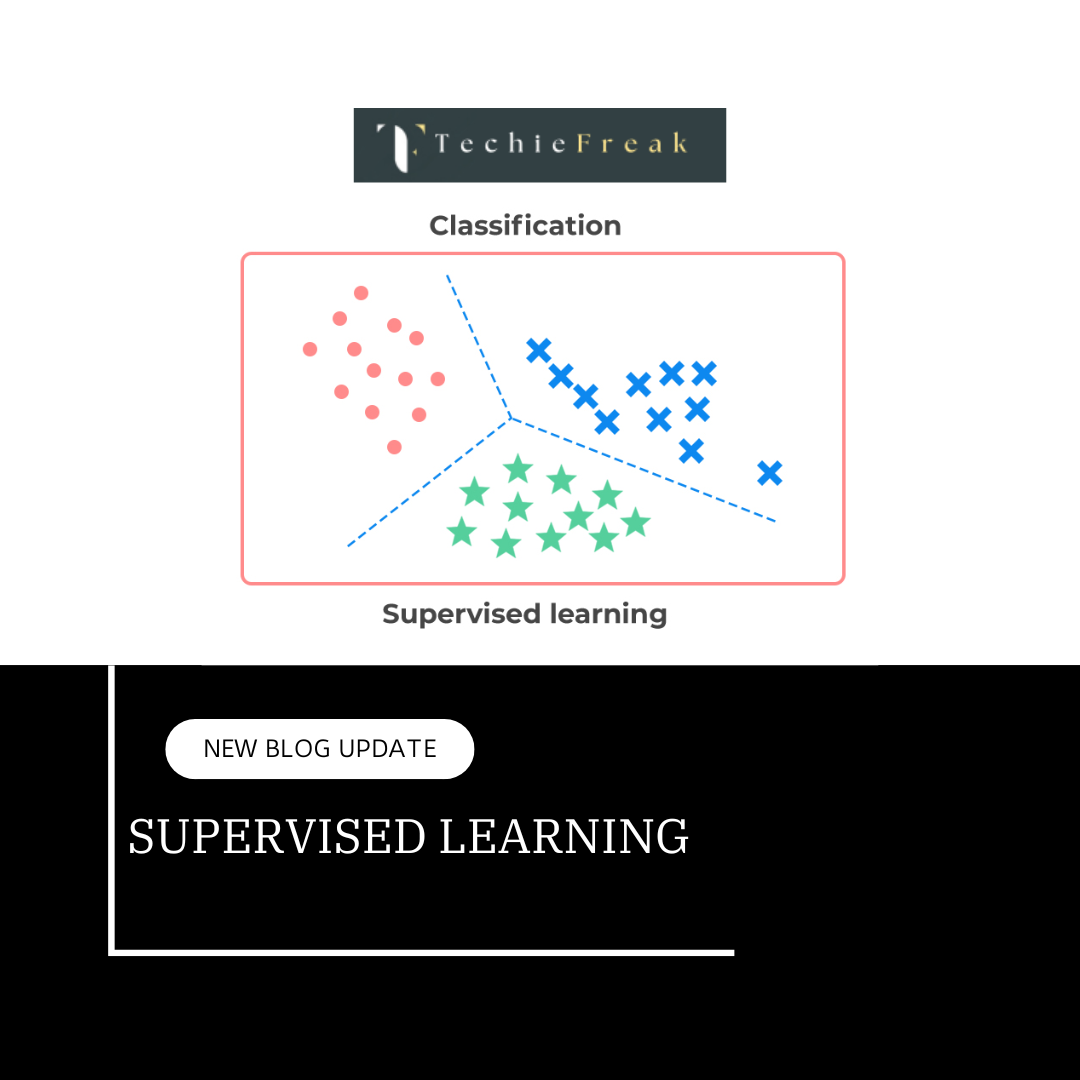
The Classification algorithm is a Supervised Learning technique that is used to identify the category of new observations on the basis of training data. In Classification, a program learns from the given dataset or observations and then classifies new observation into a number of classes or groups. Such as, Yes or No, 0 or 1, Spam or Not Spam, cat or dog, etc. Classes can be called as targets/labels or categories.
Unlike regression, the output variable of Classification is a category, not a value, such as "Green or Blue", "fruit or animal", etc. Since the Classification algorithm is a Supervised learning technique, hence it takes labeled input data, which means it contains input with the corresponding output.Here, we will dive into four widely used classification algorithms: Logistic Regression, K-Nearest Neighbors (KNN), Support Vector Machines (SVM), and Decision Trees.
1. Logistic Regression
Logistic regression is one of the most popular Machine Learning algorithms, which comes under the Supervised Learning technique. It is used for predicting the categorical dependent variable using a given set of independent variables.
Logistic regression predicts the output of a categorical dependent variable. Therefore the outcome must be a categorical or discrete value. It can be either Yes or No, 0 or 1, true or False, etc. but instead of giving the exact value as 0 and 1, it gives the probabilistic values which lie between 0 and 1.
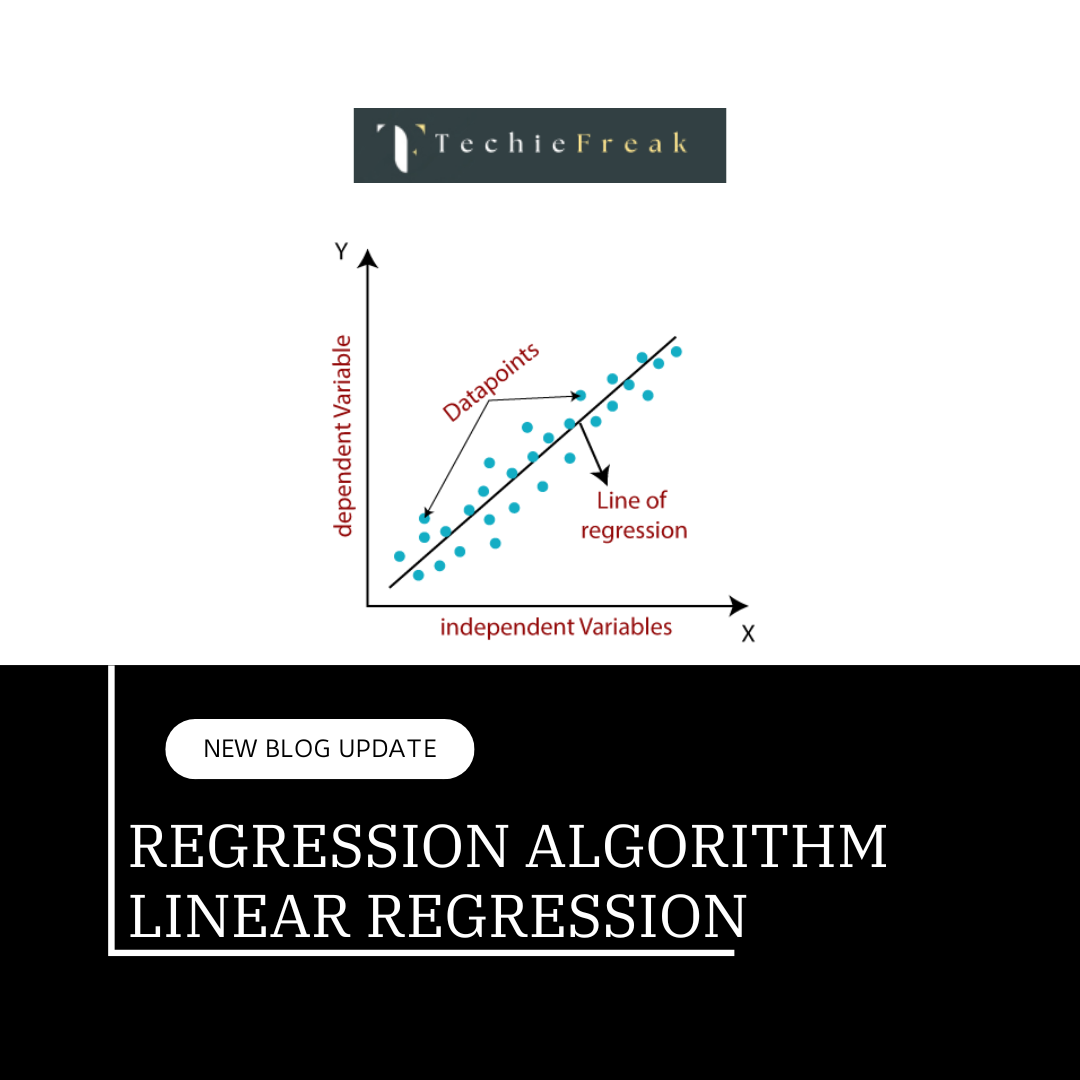
Logistic Regression is much similar to the Linear Regression except that how they are used. Linear Regression is used for solving Regression problems, whereas Logistic regression is used for solving the classification problems.
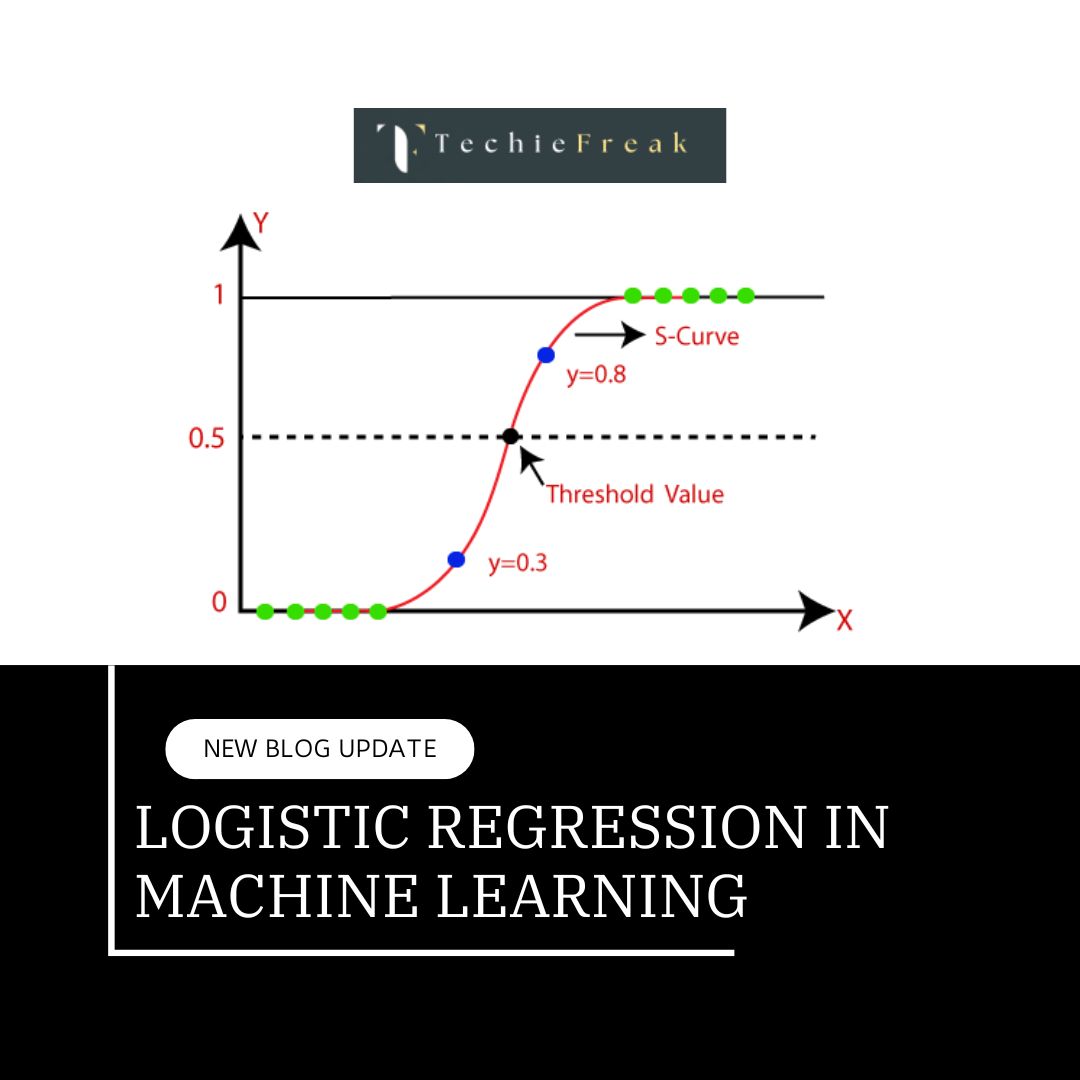
In Logistic regression, instead of fitting a regression line, we fit an "S" shaped logistic function, which predicts two maximum values (0 or 1).
The curve from the logistic function indicates the likelihood of something such as whether the cells are cancerous or not, a mouse is obese or not based on its weight, etc.
Logistic Regression is a significant machine learning algorithm because it has the ability to provide probabilities and classify new data using continuous and discrete datasets.
Logistic Function (Sigmoid Function):
The sigmoid function is a mathematical function used to map the predicted values to probabilities. It maps any real value into another value within a range of 0 and 1. The value of the logistic regression must be between 0 and 1, which cannot go beyond this limit, so it forms a curve like the "S" form. The S-form curve is called the Sigmoid function or the logistic function. In logistic regression, we use the concept of the threshold value, which defines the probability of either 0 or 1. Such as values above the threshold value tends to 1, and a value below the threshold values tends to 0.
Type of Logistic Regression:
On the basis of the categories, Logistic Regression can be classified into three types:
Binomial: In binomial Logistic regression, there can be only two possible types of the dependent variables, such as 0 or 1, Pass or Fail, etc.
Multinomial: In multinomial Logistic regression, there can be 3 or more possible unordered types of the dependent variable, such as "cat", "dogs", or "sheep"
Ordinal: In ordinal Logistic regression, there can be 3 or more possible ordered types of dependent variables, such as "low", "Medium", or "High".
- How It Works: The model predicts the probability that the output belongs to a particular class, and based on a threshold (commonly 0.5), it assigns the data to the corresponding class.
Formula:

Where P(Y=1∣X) is the probability that the target variable Y equals 1, given input X.
- When to Use: Logistic regression is ideal for binary classification problems, such as spam detection or customer churn prediction.
- Strengths:
- Simple and efficient
- Interpretable coefficients
- Works well with smaller datasets
- Limitations:
- Assumes a linear decision boundary, which may not be suitable for complex relationships
- Sensitive to imbalanced datasets
2. K-Nearest Neighbors (KNN)
K-Nearest Neighbour is one of the simplest Machine Learning algorithms based on Supervised Learning technique.
K-NN algorithm assumes the similarity between the new case/data and available cases and put the new case into the category that is most similar to the available categories.
K-NN algorithm stores all the available data and classifies a new data point based on the similarity. This means when new data appears then it can be easily classified into a well suite category by using K- NN algorithm.
K-NN algorithm can be used for Regression as well as for Classification but mostly it is used for the Classification problems.
K-NN is a non-parametric algorithm, which means it does not make any assumption on underlying data.
It is also called a lazy learner algorithm because it does not learn from the training set immediately instead it stores the dataset and at the time of classification, it performs an action on the dataset.
KNN algorithm at the training phase just stores the dataset and when it gets new data, then it classifies that data into a category that is much similar to the new data.
- How It Works:
- For a given test point, the algorithm calculates the distance (e.g., Euclidean) to all training points.
- It selects the K nearest neighbors.
- The majority class among the K neighbors is assigned to the test point.
How to select the value of K in the K-NN Algorithm?
Below are some points to remember while selecting the value of K in the K-NN algorithm:
There is no particular way to determine the best value for "K", so we need to try some values to find the best out of them. The most preferred value for K is 5.
A very low value for K such as K=1 or K=2, can be noisy and lead to the effects of outliers in the model.
Large values for K are good, but it may find some difficulties.
- When to Use: KNN is best suited for simple classification tasks with a well-defined feature space.
- Strengths:
- Simple and easy to implement
- No training phase, making it fast for smaller datasets
- Limitations:
- Computationally expensive during prediction as it requires calculating distances to all training points
- Sensitive to irrelevant or redundant features
3. Support Vector Machines (SVM)
Support Vector Machine or SVM is one of the most popular Supervised Learning algorithms, which is used for Classification as well as Regression problems. However, primarily, it is used for Classification problems in Machine Learning.
The goal of the SVM algorithm is to create the best line or decision boundary that can segregate n-dimensional space into classes so that we can easily put the new data point in the correct category in the future. This best decision boundary is called a hyperplane.
SVM chooses the extreme points/vectors that help in creating the hyperplane. These extreme cases are called as support vectors, and hence algorithm is termed as Support Vector Machine
Types of SVM
SVM can be of two types:
Linear SVM: Linear SVM is used for linearly separable data, which means if a dataset can be classified into two classes by using a single straight line, then such data is termed as linearly separable data, and classifier is used called as Linear SVM classifier.
Non-linear SVM: Non-Linear SVM is used for non-linearly separated data, which means if a dataset cannot be classified by using a straight line, then such data is termed as non-linear data and classifier used is called as Non-linear SVM classifier.
- How It Works:
- SVM constructs a hyperplane or set of hyperplanes that divides the data points into different classes.
- The goal is to maximize the margin, which is the distance between the hyperplane and the closest data points from either class (known as support vectors).
- For non-linearly separable data, SVM uses a kernel trick to map the data into a higher-dimensional space where a linear hyperplane can separate the classes.
- When to Use: SVM is highly effective for high-dimensional spaces and cases where there is a clear margin of separation between classes, such as image classification or text classification.
- Strengths:
- Effective in high-dimensional spaces
- Works well with non-linear decision boundaries using kernel functions
- Robust to overfitting, especially in high-dimensional space
- Limitations:
- Computationally expensive for large datasets
- Sensitive to the choice of kernel and tuning parameters
4. Decision Trees
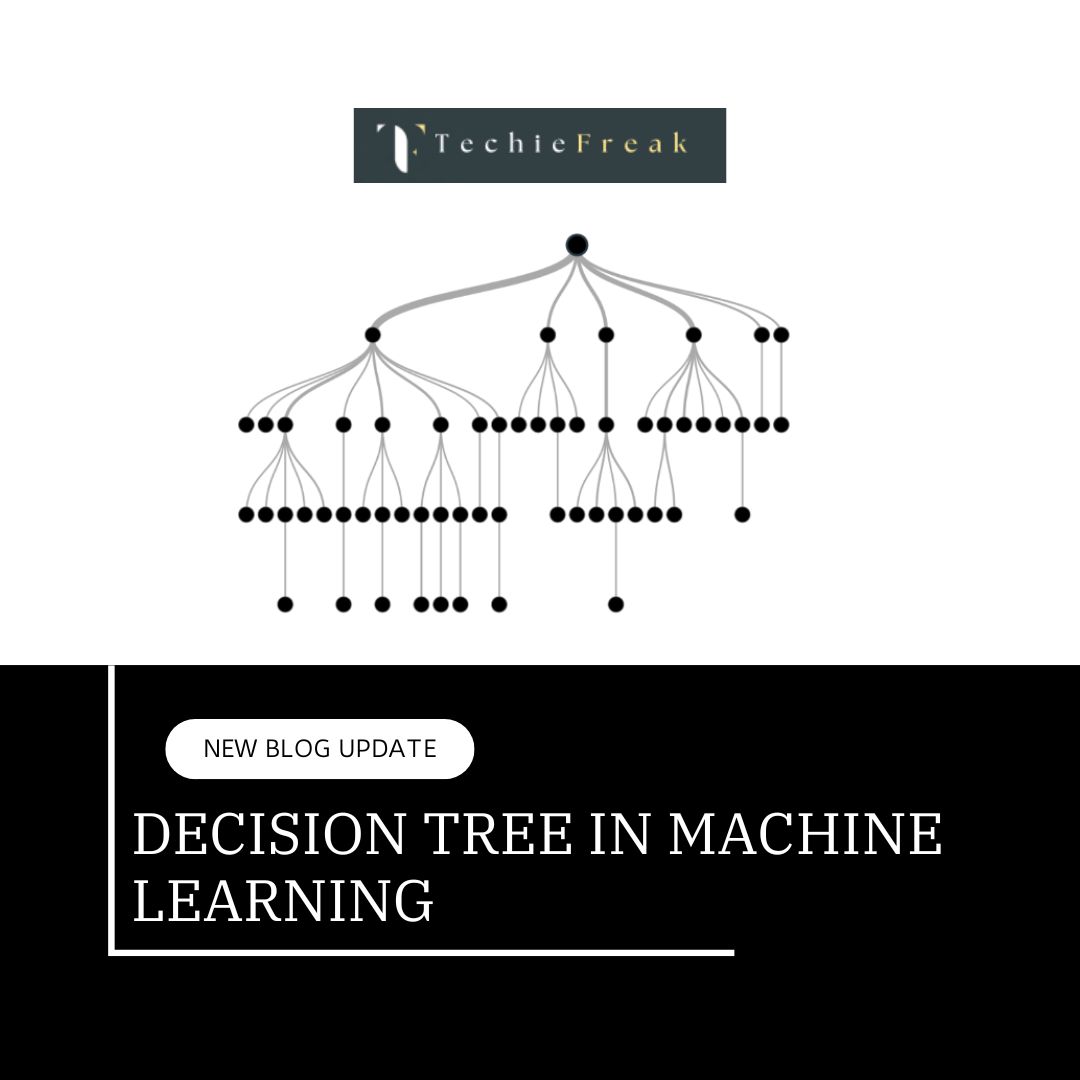
Decision trees are supervised learning models used for both classification and regression tasks. They are structured as a tree-like flowchart, where internal nodes represent decisions based on features, branches represent outcomes of those decisions, and leaf nodes represent class labels or continuous values.
- How Decision Trees Work
- Root Node:
- Represents the entire dataset and splits it based on the best feature.
- Splitting:
- At each node, the dataset is divided into subsets based on a feature that maximizes the separation between classes or minimizes error in regression.
- Common splitting criteria:
- Gini Impurity: Measures the likelihood of incorrect classification.
- Entropy: Measures information gain using a logarithmic function.
- Mean Squared Error (MSE): Used for regression tasks.
- Leaf Nodes:
- Represent the final output (a class label for classification or a predicted value for regression).
- Recursive Partitioning:
- The tree grows by recursively splitting the data at each node until stopping criteria are met (e.g., no further splits improve the result or a minimum number of samples is reached).
- When to Use: Decision trees are ideal for problems where interpretability is important, and they work well on both classification and regression tasks.
- Strengths:
- Easy to interpret and visualize
- Can handle both numerical and categorical data
- Performs well with large datasets and non-linear relationships
- Limitations:
- Prone to overfitting, especially with deep trees
- Sensitive to noisy data
- Can create overly complex models without pruning
Key Takeaways
Each classification algorithm has its own strengths, weaknesses, and ideal use cases:
- Logistic Regression: Best for binary classification with linear decision boundaries.
- K-Nearest Neighbors (KNN): Simple, but computationally expensive and sensitive to irrelevant features.
- Support Vector Machines (SVM): Powerful for complex, high-dimensional data, but computationally intensive.
- Decision Trees: Easy to interpret and visualize, but prone to overfitting without proper pruning.
Choosing the right classification algorithm depends on the nature of your data, the complexity of the problem, and the importance of interpretability versus performance. Experimenting with different algorithms and tuning their parameters is often the best approach to achieving optimal results.
.png)
.png)
.png)
.png)
.png)
.png)
 Algorithm for Machine Learning.jpg)
 Algorithm.jpg)
.png)
.png)
.png)
.png)
.png)
.png)
