
Tool for Data Analysis and Visualization: Power BI
Power BI is a business analytics and data visualization tool developed by Microsoft that enables users to transform raw data into meaningful insights through interactive dashboards, reports, and visualizations. It is part of the Microsoft Power Platform and integrates seamlessly with other Microsoft services like Excel, Azure, SQL Server, and SharePoint, making it an accessible and robust tool for enterprises and individual users.
Introduction to Power BI
Power BI helps organizations make data-driven decisions by allowing them to visualize and analyze their data with greater efficiency and understanding. Its intuitive interface supports drag-and-drop features, pre-built data connectors, and natural language query capabilities. Users can build custom reports and dashboards, uncover hidden trends, and share insights with others in real time.
Power BI consists of several components that together offer a complete suite for business intelligence:
- Power BI Desktop: A free Windows application for creating reports and dashboards.
- Power BI Service: A cloud-based platform for sharing and collaborating on Power BI content.
- Power BI Mobile: Apps for viewing and interacting with reports on mobile devices.
- Power BI Report Server: An on-premises solution for hosting Power BI reports.
- Power BI Gateway: Connects on-premises data sources to Power BI Service securely.
Key Components of Power BI
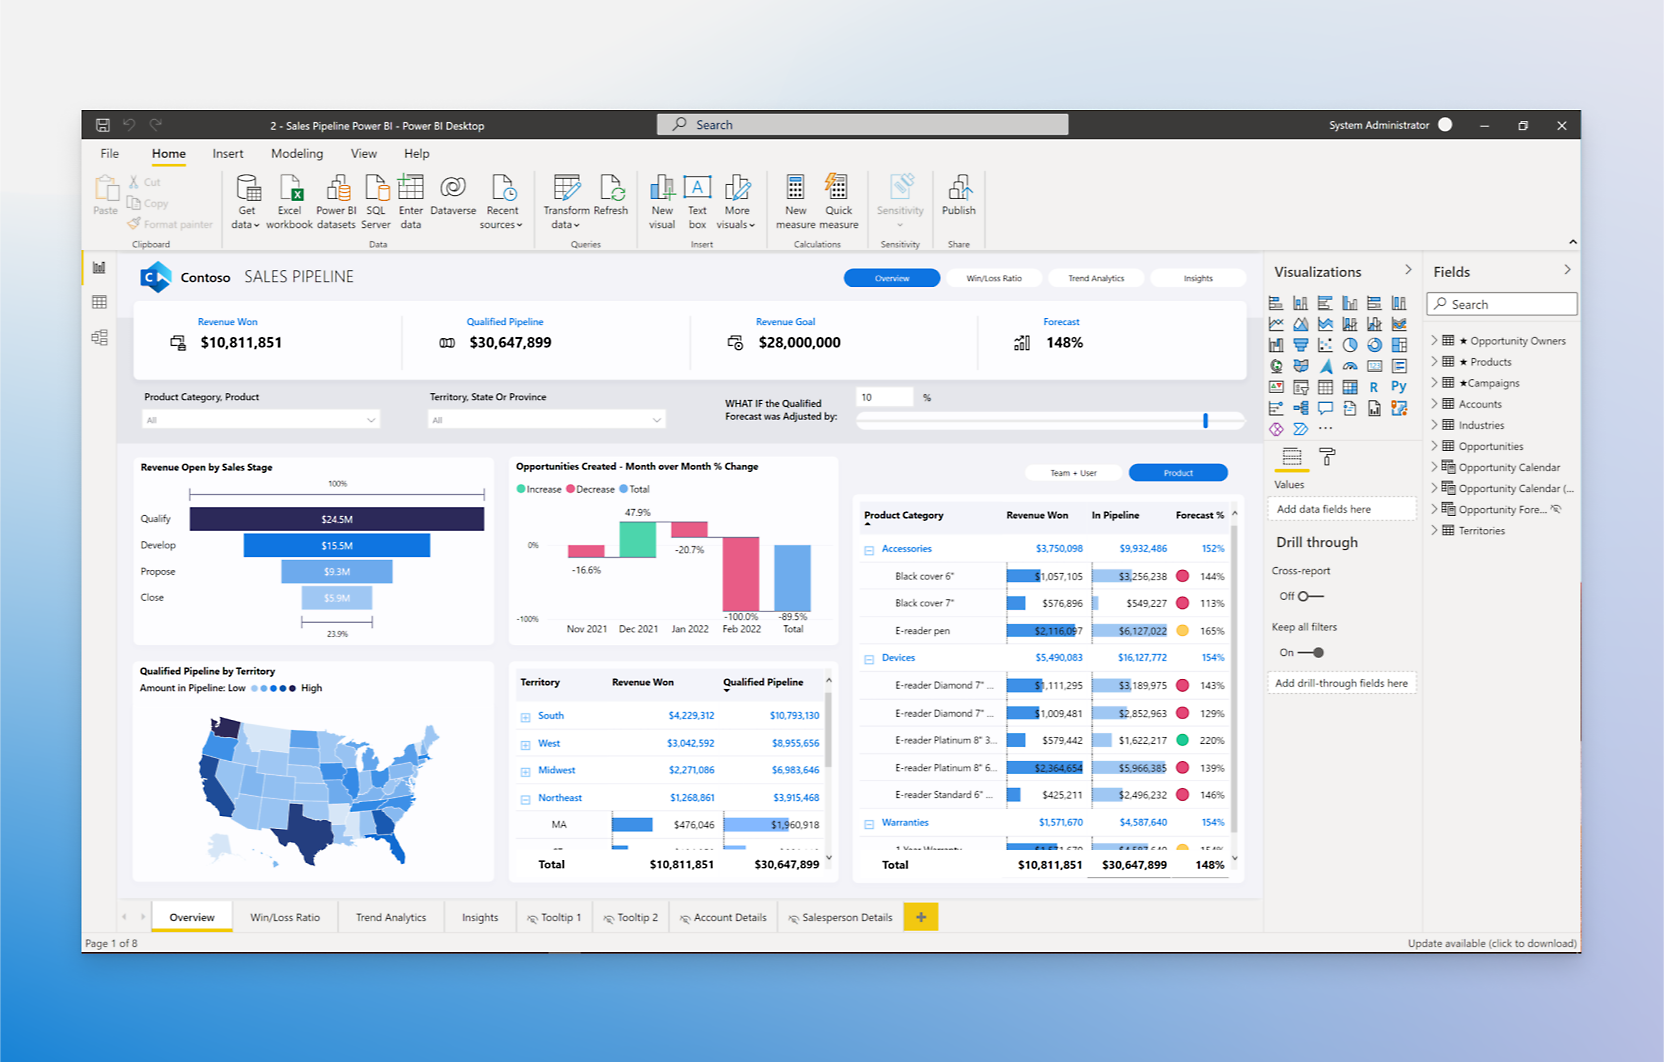
1. Power BI Desktop
Power BI Desktop is the main authoring and publishing tool. It allows users to connect to multiple data sources, clean and transform data, define data models, and build visuals.
2. Power BI Service (PowerBI.com)
This is the cloud-based platform where users can publish, view, and share reports. It supports collaboration, scheduling data refreshes, and creating dashboards by pinning visuals from multiple reports.
3. Power BI Mobile
The mobile application provides real-time access to reports and dashboards on iOS, Android, and Windows devices. It ensures users stay connected to their data on the go.
4. Power BI Gateway
The gateway bridges on-premises data sources and the Power BI Service, enabling real-time or scheduled data updates.
5. Power BI Embedded
It allows developers to embed Power BI visuals into applications and websites using REST APIs and client SDKs.
Architecture of Power BI
Power BI has a layered architecture consisting of the following key layers:
- Data Layer: Connects to various data sources such as Excel, SQL Server, APIs, Azure, and more.
- Data Transformation Layer: Uses Power Query (M language) to clean, shape, and transform data.
- Data Model Layer: Allows building of relationships between tables and creation of measures using DAX (Data Analysis Expressions).
- Visualization Layer: Enables creation of charts, tables, slicers, KPIs, and dashboards.
- Collaboration Layer: Sharing, publishing, and commenting on reports and dashboards.
Core Functionalities of Power BI
1. Data Connectivity
Power BI supports over 100 connectors, including:
- Excel, CSV
- SQL Server, Oracle, MySQL
- Azure services (Azure SQL DB, Azure Blob Storage)
- Google Analytics, Salesforce, Facebook
Users can connect live or import data into Power BI’s in-memory engine for faster performance.
2. Data Preparation (Power Query)
With Power Query Editor, users can:
- Clean and filter data
- Merge and append datasets
- Change data types
- Apply transformations (pivot, unpivot, split columns)
- Remove duplicates or blank rows
3. Data Modeling
Power BI provides advanced data modeling features:
- Create relationships between tables (one-to-many, many-to-one)
- Define calculated columns, measures, and KPIs using DAX
- Create hierarchies (e.g., Year > Quarter > Month)
4. Visualizations
Power BI is a powerful business intelligence tool that transforms raw data into insightful, interactive visuals. It offers a wide variety of built-in charts and visuals, along with tools to make reports more dynamic and user-friendly.
Core Visualization Types
Power BI provides several default visualization options to represent data in different forms:
1. Bar, Line, and Pie Charts
- Bar Charts: Useful for comparing values across categories. For example, showing total sales per product.
- Line Charts: Ideal for visualizing trends over time, such as monthly revenue or stock prices.
- Pie Charts: Represent part-to-whole relationships, like percentage sales contribution by region.
These are some of the most frequently used visuals for high-level summaries.
2. Matrix and Tables
- Tables: Display raw data in rows and columns, just like a spreadsheet. Helpful for detailed reporting.
- Matrix: Similar to pivot tables in Excel, matrices allow hierarchical row and column grouping, aggregating values, and enabling drill-down into different levels (e.g., Category → Subcategory → Product).
These visuals are best when detail and structure are important.
3. Maps (Basic and ArcGIS)
- Basic Maps: Plot data points using latitude/longitude or geographic names like country/state.
- ArcGIS Maps: Provide enhanced geographic visualization with detailed map layers, demographics, heat maps, and spatial analytics powered by Esri's ArcGIS platform.
Maps are perfect for visualizing regional performance or geographic trends.
4. Cards and KPIs
- Cards: Show a single number such as total revenue or number of customers. Ideal for key performance indicators.
- KPI Visuals: Compare actual values to targets and indicate performance status (e.g., red for underperformance, green for above target).
These visuals are used to highlight business-critical metrics at a glance.
5. Custom Visuals from Marketplace
Power BI’s marketplace (AppSource) offers a wide range of custom visuals developed by Microsoft and third-party developers. These include:
- Funnel charts
- Word clouds
- Bullet charts
- Sankey diagrams
- Gantt charts
Custom visuals extend Power BI’s capabilities and allow users to create industry-specific or highly specialized reports.
Enhancing Visualizations
To make reports more interactive, informative, and user-friendly, Power BI supports several enhancement features:
1. Tooltips
Tooltips appear when users hover over a visual element. You can show additional context or detailed data, and even design custom tooltip pages with visuals inside them.
✅ Example: Hovering over a bar in a sales chart reveals profit, cost, and product count.
2. Drill-through Pages
Drill-through allows users to right-click on a visual and "drill" into a detailed page with data specific to that selection. It’s perfect for breaking down summary visuals into more focused reports.
✅ Example: Clicking on a product category opens a detailed page about that category's subproducts.
3. Conditional Formatting
This feature allows you to dynamically change:
- Font colors
- Background colors
- Data bars or icons
...based on data values. It visually highlights highs, lows, or outliers.
✅ Example: In a sales table, cells turn green for high performance and red for low.
4. Bookmarks and Slicers
- Bookmarks: Save the state of a report (filters, visuals, visibility) and return to it later. Useful for storytelling and guided navigation in reports.
- Slicers: Act as interactive filters for the report. Users can click on slicers to filter data across multiple visuals.
✅ Example: A year slicer lets you filter all charts on the page to show only 2023 data.
5. Dashboard Creation
Dashboards are created by pinning visuals from different reports. They provide a high-level summary and can include:
- Tiles from multiple datasets
- Real-time data streams
- Alerts and Q&A support
6. Collaboration and Sharing
Users can:
- Share reports with others via Power BI Service
- Publish to web (public sharing)
- Export to PDF or PowerPoint
- Embed in Microsoft Teams or SharePoint
- Use workspaces to collaborate with teams
Advantages of Power BI
- Integration with Microsoft Ecosystem: Seamless compatibility with Excel, Azure, and Teams.
- Ease of Use: Intuitive interface with drag-and-drop functionality.
- Scalability: Suitable for both small businesses and large enterprises.
- Real-time Dashboards: Supports real-time analytics using streaming datasets.
- Custom Visuals: Access to a marketplace for specialized visuals.
- Natural Language Query: Ask data-related questions using plain English.
- Security: Robust security with row-level security (RLS) and Azure Active Directory integration.
Limitations of Power BI
- Performance Limitations: May struggle with extremely large datasets without optimization.
- Limited Flexibility in Free Version: Advanced features and sharing options require Pro or Premium licenses.
- Complex DAX Learning Curve: DAX has a steep learning curve for advanced modeling.
- Customization Constraints: Custom visuals and formatting can be limiting compared to tools like Tableau.
Use Cases Across Industries
- Finance: Budget tracking, forecasting, and financial reporting
- Retail: Sales performance, inventory management, and customer segmentation
- Healthcare: Patient data analysis, treatment efficiency, hospital resource management
- Manufacturing: Quality control, supply chain monitoring, production tracking
- Education: Student performance, attendance dashboards, and resource allocation
Power BI vs Other Tools
| Feature | Power BI | Tableau | Excel |
|---|---|---|---|
| Ease of Use | High | Medium | High |
| Custom Visuals | Available | Extensive | Limited |
| Data Modeling | Strong (DAX) | Moderate | Basic |
| Cost | Affordable | Expensive | Already included |
| Collaboration | Integrated with MS | External (Tableau Server) | Limited |
| Real-time Data | Yes | Limited | No |
Conclusion
Power BI has become one of the most powerful and user-friendly business intelligence tools in the market. Its seamless integration with Microsoft services, powerful data modeling capabilities, and wide range of visualizations make it ideal for organizations looking to democratize data access and foster a data-driven culture.
Understanding the theory behind Power BI, from its architecture to its key features, provides the foundational knowledge necessary for implementing and leveraging this tool effectively for analytical and strategic purposes.


.jpg)


.jpg)


.png)
.png)
.png)
.png)
.png)
.png)
.png)
.png)
.png)
.png)
.png)
.png)
.png)
.png)
.png)
.png)
.png)
.png)
.png)
.png)
.png)
.png)
.png)
.png)
.png)
.png)

.png)
.png)
.png)
.png)
.png)
.png)
.png)


